


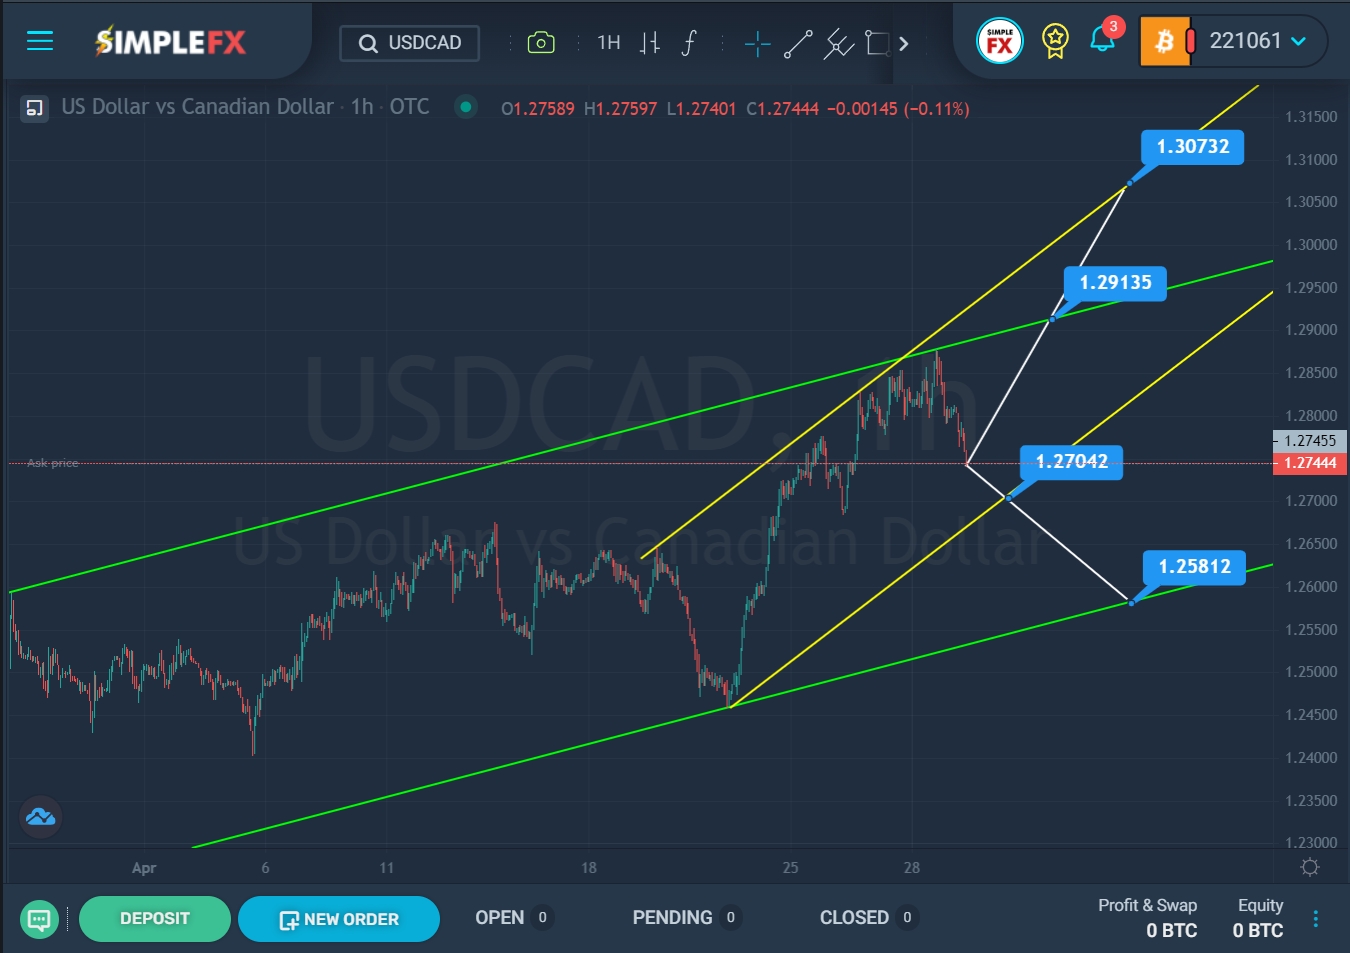
The current formation of the USDCAD currency pair indicates that an uptrend is forming, which moves inside the green channel.

SimpleFX USDCAD Chart Analysis: April 29, 2022
On the current chart, we see that the market moved from the upper green line to the lower green line from the end of March to the end of April. The price touched the lower green wall at the end of April and then jumped up to the upper green line in a few days. So far, the resistance line has not allowed the bulls to go higher.
There is a high probability that the bulls will again lead prices up in the direction of the resistance level of 1.291. If this price level breaks, the bullish trend may continue to the next important resistance level of 1.307, which is located on the upper yellow line.
Alternatively, the downward direction of the price to the lower green line is suggested. With greater pressure on bears, there is a risk of a breakdown of the support level of 1.270. If the lower yellow wall is broken, then the downward trend will continue its development in the direction of the lower green line and the support level of 1.258.
When confirming a bull market, it is recommended to consider opening deals for purchases. If the second option is confirmed on the market, then it is recommended to consider opening sales transactions.


