


The current formation of BMW.DE shares hints at a global downtrend that is moving within a large green channel.
Until mid-January, the price steadily rose from the lower green line to the upper green line. Then it reached the upper green wall, after which it pushed off from it and began to move in the opposite direction.
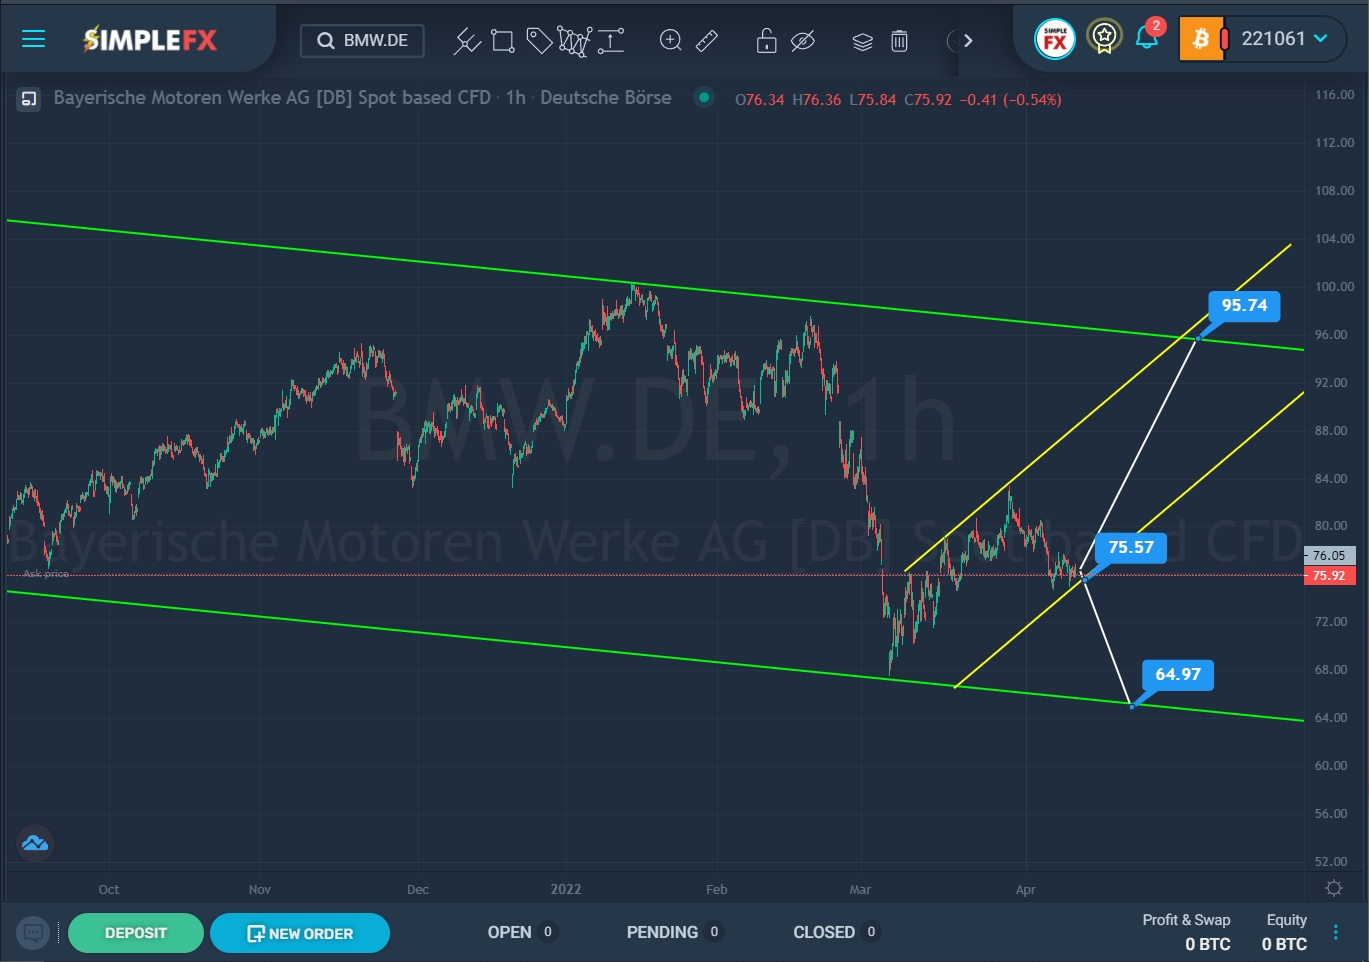

SimpleFX BMW.DE Chart Analysis: April 12, 2022.
However, the bulls made a second attempt to break through the upper wall, and literally, a month later they again approached the green resistance line. The attempt was unsuccessful, moreover, bears entered the market and in a short period of time sent the price to the lower green area. Not so long ago, the price pushed off from the lower green wall and began to grow rapidly within a small yellow channel.
If we pay attention to the last section of the chart, we will notice that the price is next to the lower yellow wall. Perhaps soon the bears will bring the price to the support level of 75.57 located on the lower yellow wall. With a successful breakdown of this level, the price of BMW.DE shares may fall again to the support level of 64.97, which is located on the lower green line.
Alternatively, the price can immediately reverse from the current level, or from the support level of 75.57, and start an upward movement. A bullish trend can form inside the yellow channel in the direction of the upper green line and the resistance level of 95.74.


