


The current formation of the USDJPY currency pair suggests a global bullish trend that moves within the green channel.

SimpleFX USDJPY Chart Analysis: March 18, 2022.
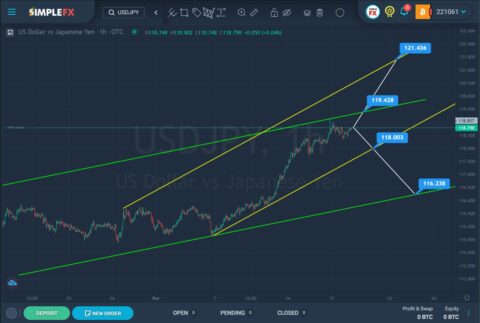
After the last pullback from the upper green wall, we saw a long downward movement of the price to the lower green line. After the price reached the green line (March 7), the bears were unable to break through it. We see that the market has turned around and started moving up. The last section of the chart describes an ascending channel of yellow color.
In the last section of the chart, we see how the bulls are actively pushing the price up. Most likely, with the same growth rate, bulls will be able to break through the resistance level of 119.42, located on the upper green line. In this case, market participants are waiting for an increase to a higher resistance level of 121.43, which is located on the upper yellow line.
If the bulls fail to break through the upper green wall, the price may push off and start moving downward to the lower yellow line. With a successful breakdown of the support level of 118.93, the bears will open the way to the lower green line and the support level of 116.23.
An approximate scheme of possible future movement is shown on the chart.
When the market is bullish, it is recommended to consider opening long positions. If the price falls, we can consider opening sales deals.


