


After Tuesday in the red, futures on the Standard & Poor’s 500 index rose strongly early Wednesday, as did S&P 500 futures and Nasdaq futures. Monday’s stock market rally lost further ground after Russian President Vladimir Putin recognized breakaway territories in Ukraine as independent and the West imposed targeted sanctions in response.
The current structure of the DJI30 index suggests the formation of a global uptrend that moves inside a large green channel. On the current chart, we see the price movement since the end of January.

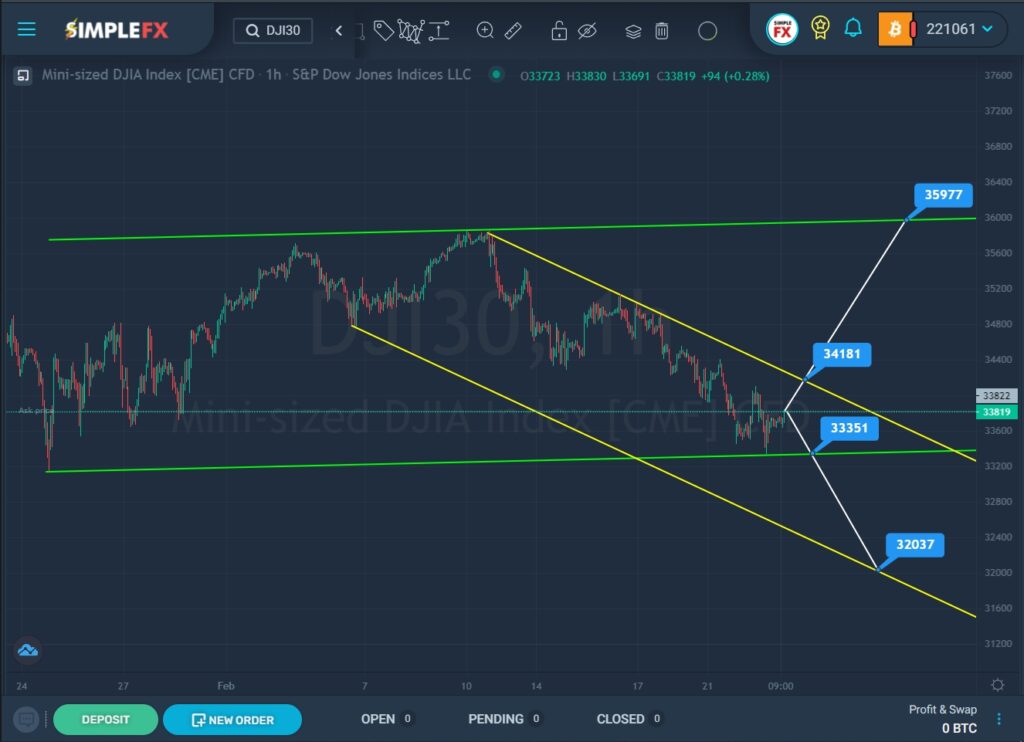
At the end of January, the price fell to the lower green line. After that, the market rapidly, in a zigzag shape, crept up. On February 10, the bulls reached the upper green wall but did not break through it. Having pushed off from the green resistance line, the price began to fall within the descending yellow channel.
In the last section of the chart, we see how the price bounced off the lower green line. Perhaps after this rebound, a bullish trend will prevail in the market. To begin with, the bulls need to break through the upper yellow line near 34181. If this price mark is broken, the price may start to rise in the direction of the resistance level of 35977, which is on the upper wall of the green channel. In this case, it is possible to consider opening long positions.
Alternatively, a repeated fall to the lower green line and the support level of 33351 is expected. If this level is broken, the bears can bring the market to the lower yellow line and the support level of 32037. In this case, it is possible to consider opening short positions.


