


For the EURJPY currency pair, we see a large uptrend that moves within the green channel. On the current chart, we see the price movement from the end of January to the present day.

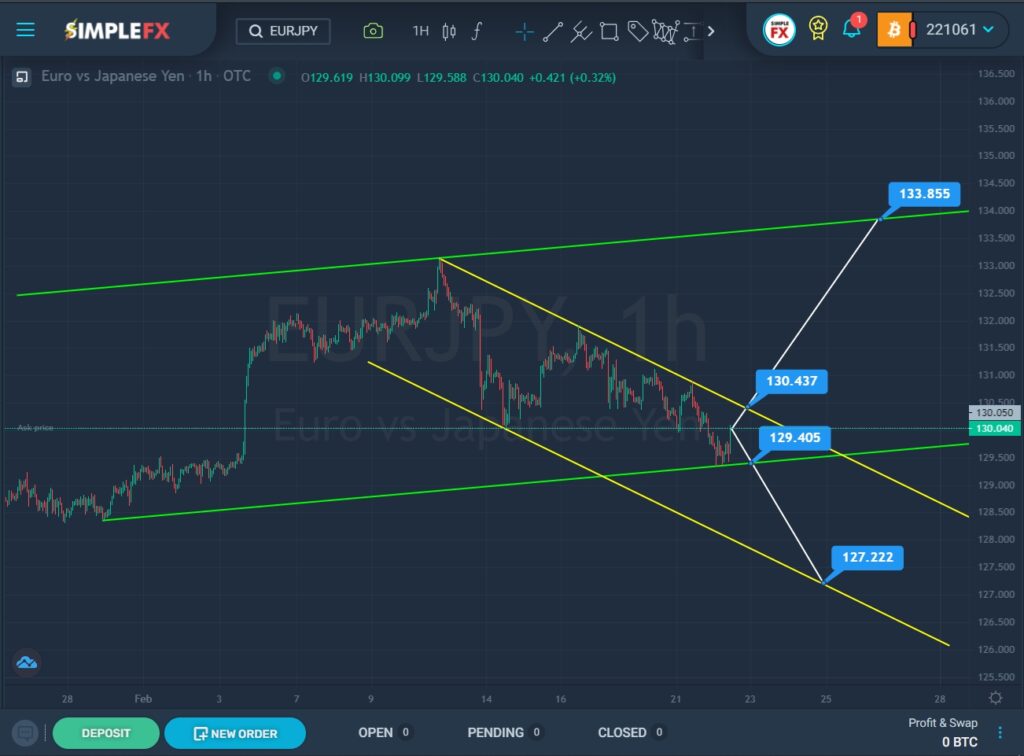
At the end of January, the price touched the lower green line, then pushed off from it and we saw an increase in the currency pair to the upper green line. Not so long ago, the bulls reached the upper green wall, but they failed to break through it.
For a little more than a week, we observed the pair’s depreciation within the downtrend, which moves inside the yellow channel. Currently, the market is located near the lower green line. It is assumed that after the breakdown of the support level of 129.40, the price drop will continue to the next important support level of 127.22, which is located on the lower yellow line.
However, the last rebound from the lower line may give strength to the bulls to break through the resistance level of 130.43, which we see on the upper wall of the yellow channel. If this level is broken, then market participants will be able to observe a long upward movement to the resistance level of 133.85, which is located on the upper green line.


