


GBPJPY seems to be forming an uptrend that is moving inside the green channel. The current chart shows the market movement since the end of December 2021.

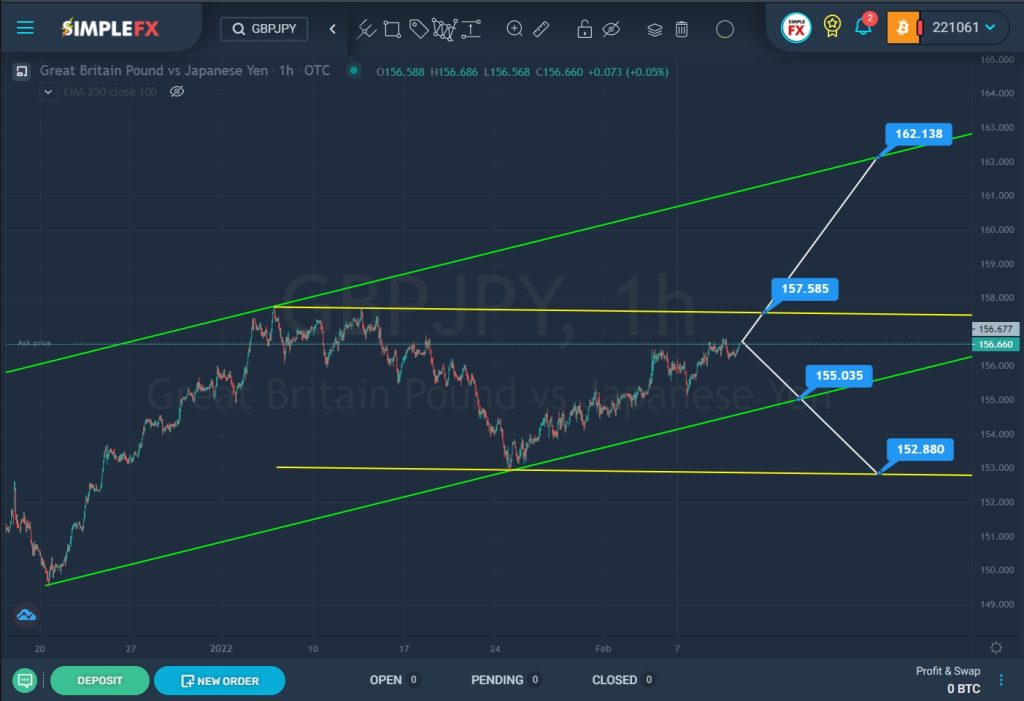
At the beginning of January, the price touched the upper green line, then pushed off from it and began to rapidly fall to the lower green line. This period describes a yellow channel with a slight downward slope. The price reached the lower green line at the intersection with the lower yellow wall at the end of January. The bears were unable to break through these lines and surrendered their positions.
In the last section of the chart, we see how the price is gradually rising up. Soon the bulls will be able to push the price to the upper yellow wall and the resistance level of 157.58. In case of a successful breakdown of this level, the price may continue to rise towards the next important level of 162.13, which is located on the upper green line.
Alternatively, it is assumed that the bearish movement of the market will resume. If the bears can break through the support level of 155.03, which is located on the lower green wall, then a path will open for them to the lower yellow line and the support level of 152.88.
With the upward movement of the market, it is recommended to consider opening long positions. With a downward price movement, it is worth considering opening sales deals.


