


On the current chart for the SPX500 index, we see the construction of a large bearish trend that moves inside the green channel.

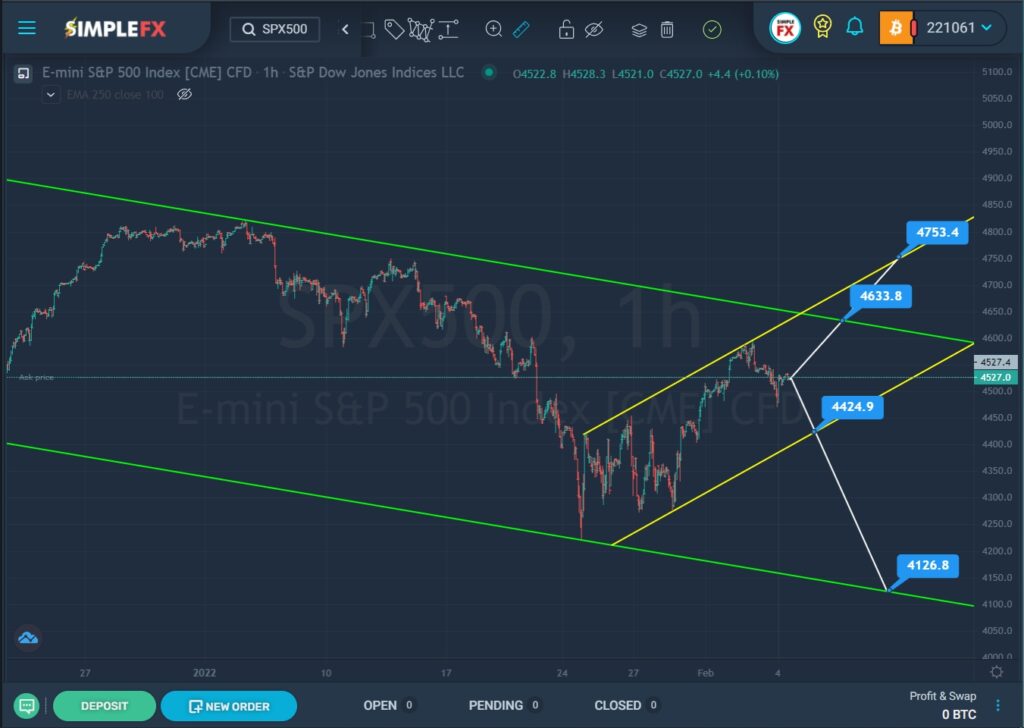
At the beginning of this year, the price touched the upper green line. Bulls could not break through this wall, so bears entered the market. By the end of the month, the price fell to the lower green wall.
In the last section of the chart, we observe an upward price movement, which describes a small yellow channel. After the last rebound from the lower green line, the market began to rapidly crawl upward. It is assumed that this growth will continue in the direction of the upper green line inside the yellow channel. If the resistance level of 4633.8 is broken, the bulls will be able to continue leading the market to the upper yellow line and the resistance level of 4753.4.
However, after the last rebound from the upper yellow wall, the bulls may not have enough strength to hold positions. In this case, it is worth considering an alternative scenario. It is assumed that the price will move in a downward direction in the next coming trading weeks. On the bears’ way, we see the lower yellow line. If the support level of 4424.9 is broken, the bearish trend can be continued to the descending green line and the support level of 4126.8.


