


The GBPAUD buyers are battling the five-month resistance of 1.9 AUD. After a period of price consolidation in a triangle pattern, buyers managed to break the pattern upwards.
The formation of the GBPAUD pair suggests the construction of a large bullish trend that moves within the green channel. During the last month, the price has been moving from the lower green line towards the upper green line. The last section of the chart describes an ascending channel of yellow color.

Not so long ago, the price pushed off from the upper yellow wall, and now we are approximately in the center of the yellow channel. In the current situation, there are two possible scenarios.
The first option assumes a continuation of the fall in value to the lower green line. However, on the bears’ way, we see the lower yellow wall. Bears first need to break through the support level of 1.888. Only if this level is broken, the price can continue to decline to the lower green line and the support level of 1.867.
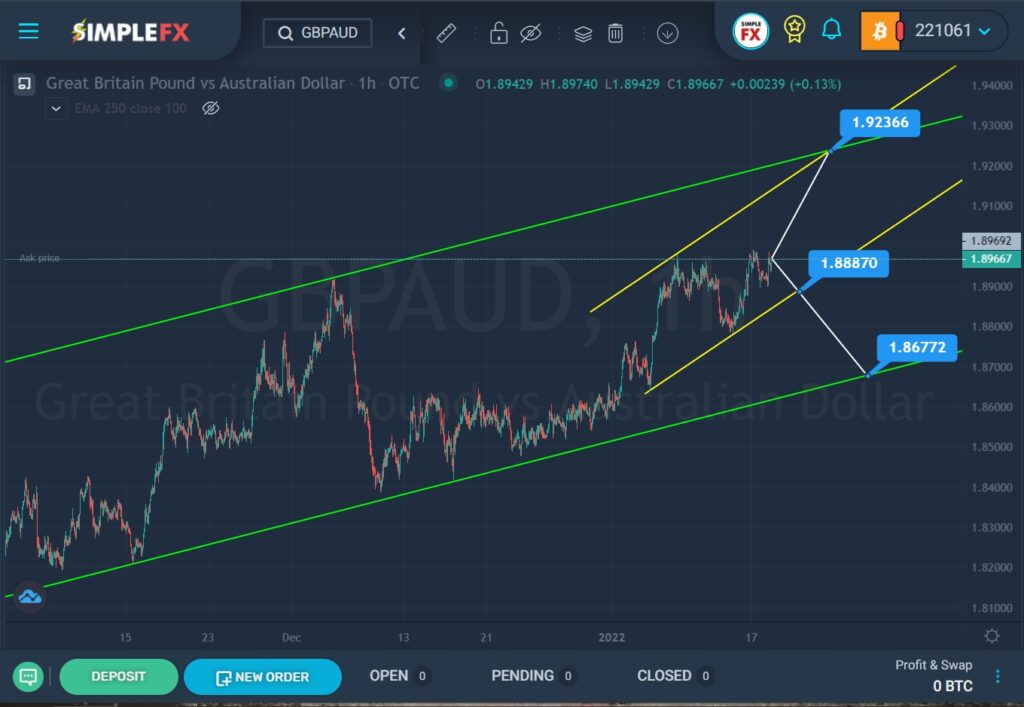
In the second option, it is assumed that the price may turn around and the bulls will have a chance to take over the market. In this case, the price is expected to move to the upper green line and the upper yellow line, as well as to the resistance level of 1.923. At that level, we see the intersection of the two upper lines of the yellow and green channels.
An approximate scheme of possible future movement is shown in the chart.


