


The S&P 500 futures rose during early morning trading on Friday, ahead of the earnings season for big banks.
The Dow Jones Industrial Average-based contracts advanced 84 points, or 0.23 percent, while S&P 500 futures increased by 0.13 percent and Nasdaq 100 futures remained unchanged.
The current structure of the DJI30 index suggests the formation of a global uptrend that moves inside a large green channel. In the current chart, we see the price movement from November to today.

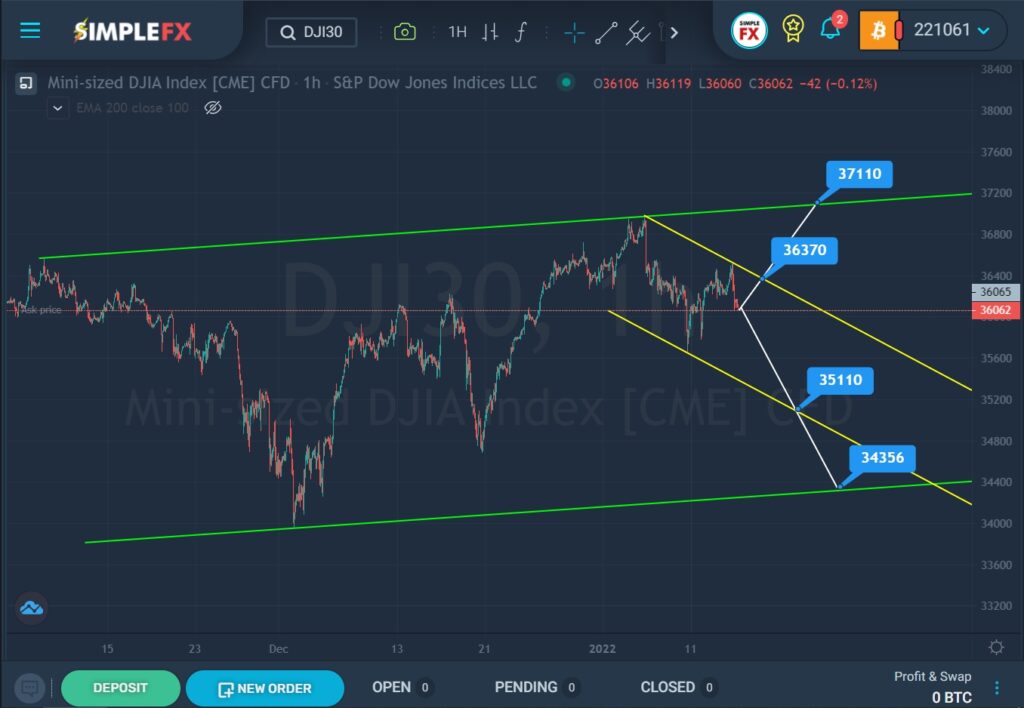
From the second half of November to the beginning of December, we see the market fall from the upper green line to the lower green line. At the beginning of December, the market reached the lower green wall, but then pushed off from it and rapidly began to move up. At the beginning of this year, the price touched the upper green line, after which it began to move in the opposite direction. The last section of the chart describes the descending channel of yellow color.
In the last section of the chart, we see how the price bounced sharply from the lower yellow wall and reached the upper yellow wall in a short period of time. There is a possibility that the upper yellow line will be broken by bulls near the resistance level of 36370. If this level is broken, then the price may rise a little more to the resistance level of 37110, which is located on the green line.
However, the last pullback from the yellow wall could give impetus to a downward movement. In this case, bears can send the market to the lower yellow wall and the support level of 35110. And in case of a breakdown of this level – even lower, to the support level of 34356 and the lower green line.


