


For the ETHUSD cryptocurrency pair, we see the formation of a global downtrend, which is gradually moving within a large green channel.

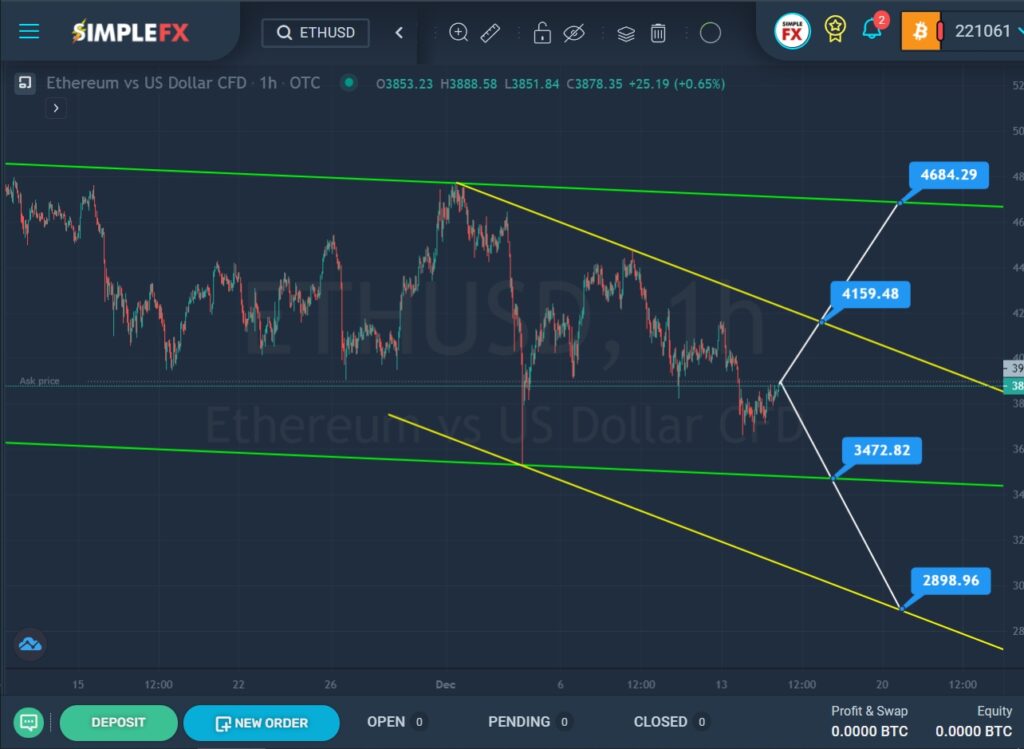
In December, the price touched the upper green wall, the bulls could not break through the resistance line, moreover, we saw a sharp drop to the lower green line in just a few days. The last section of the chart, which is formed from December to the present day, describes a descending yellow channel.
Currently, the price is close to the lower green area, but also near the upper yellow wall. In the current situation, there are two possible scenarios. Bears can continue to push the price down to the lower green line, and if they can break through the support level of 3472.82, then a path will open for them to the lower yellow line and the support level of 2898.96.
In the second option, the price can rise to the upper yellow wall and the resistance level of 4159.48. Only with a successful break of this level, market participants can wait for the growth of the currency pair. The next level, as long as the price can rise, is the resistance level of 4684.29, it is located on the upper line of the green channel.
With the downward movement of the market, it is worth considering opening sales deals. When confirming an uptrend, we can consider opening long positions.


