


The current structure of the main BTCUSD cryptocurrency pair suggests the formation of a global uptrend that moves inside a large green channel.

In the current chart, we see the price movement for a month and a half. At the end of October, the price zigzagged upwards in the upper green area, then in the first half of November, the market reached the upper green line and pushed off from it. After that, we saw a decrease in the cost of quotations to the lower green line. This period describes a small descending channel of yellow color.
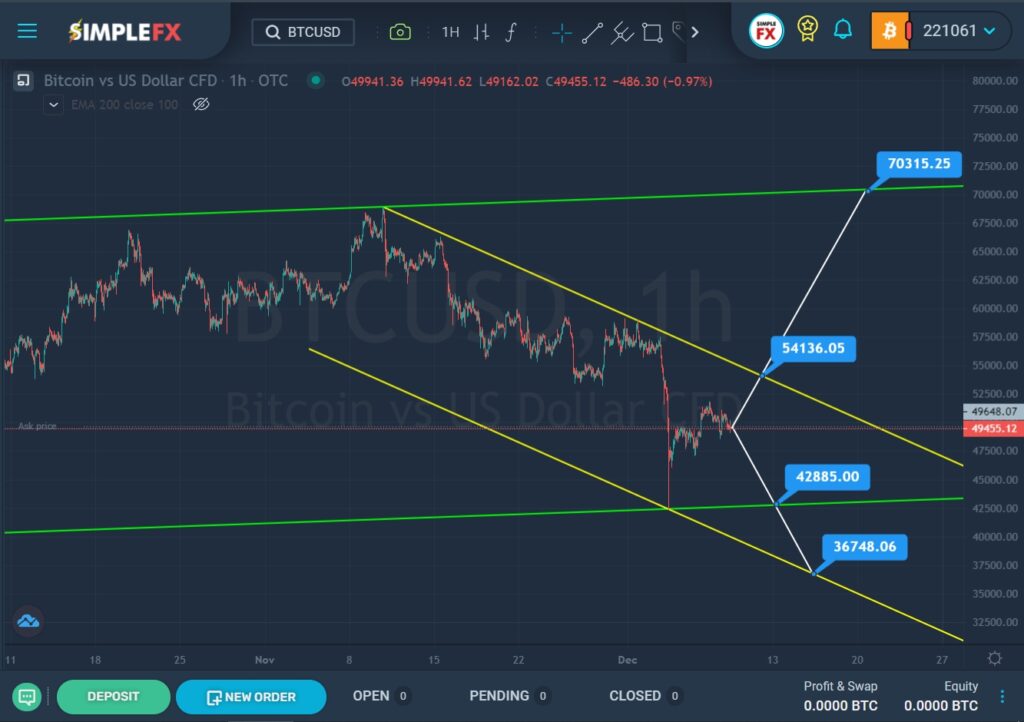
In the last section of the chart, we see that the price has reached the lower green line at the intersection with the lower yellow line. Then there was a rebound, and the price rose sharply to the center of the yellow channel. It is possible that the market will continue to move at the same pace in an upward direction to the upper yellow wall and the resistance level of 54136.05. If this level breaks, the formation of an upward trend can be continued to the upper green line and the resistance level of 70315.25.
Alternatively, a price reversal is expected and the beginning of a second decline to the lower green line. If the bears can break through the support level of 42885.00, then they will open the way to the lower wall of the yellow channel and the support level of 36748.06.


