


The current structure of the American stock index DJI30 suggests the formation of a global uptrend that moves inside a large green channel. On the current chart, we see the price movement from October to today.

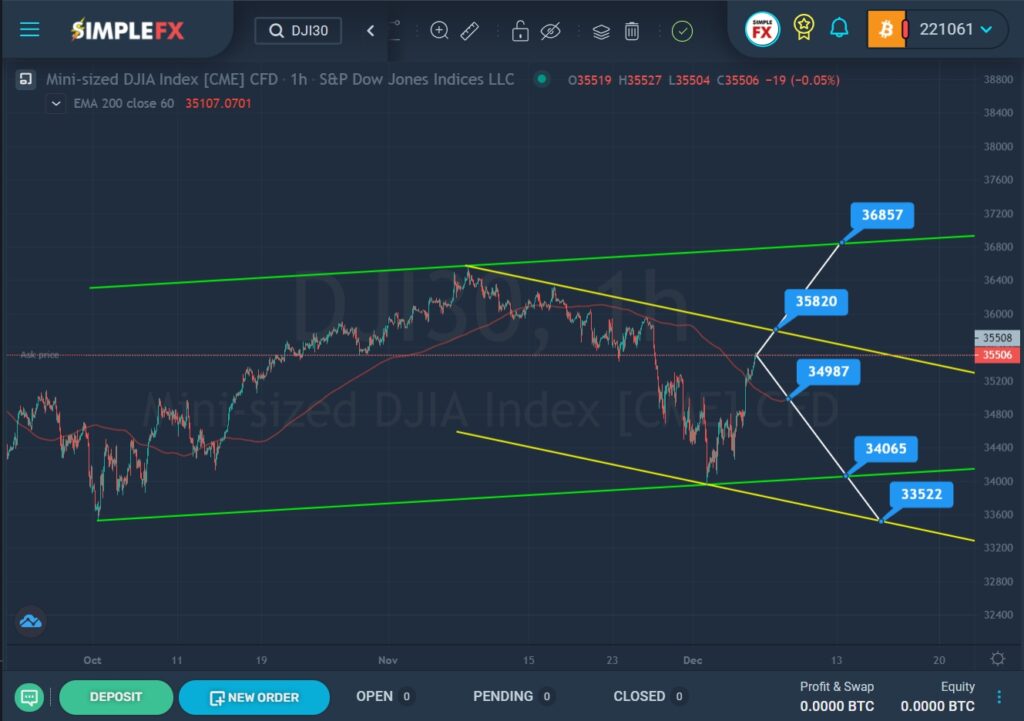
Since October, the price has been slowly but surely creeping up to the upper green line. In the first half of November, the market reached the upper green wall, but then pushed off from it and rapidly began to fall within the descending yellow channel.
Not so long ago, we saw how the price touched the lower green wall at the intersection with the lower yellow wall, and jumped sharply. Currently, the price is near the upper yellow wall and the resistance level of 35820. With a successful break of this level, the bulls will open the way to the upper green line and the resistance level of 36857.
Alternatively, a market reversal and the beginning of a price decline to the lower green line is possible. On the bears’ way, we see a moving average line. If the bears are able to break through the support level of 34987, located on this red line, then the bearish trend will be confirmed and market participants may expect a price drop to the lower green wall and the support level of 34065. In case of a break of this price level, the price may fall even lower – to the support level of 33522, which is located on the lower line of the yellow channel.


