


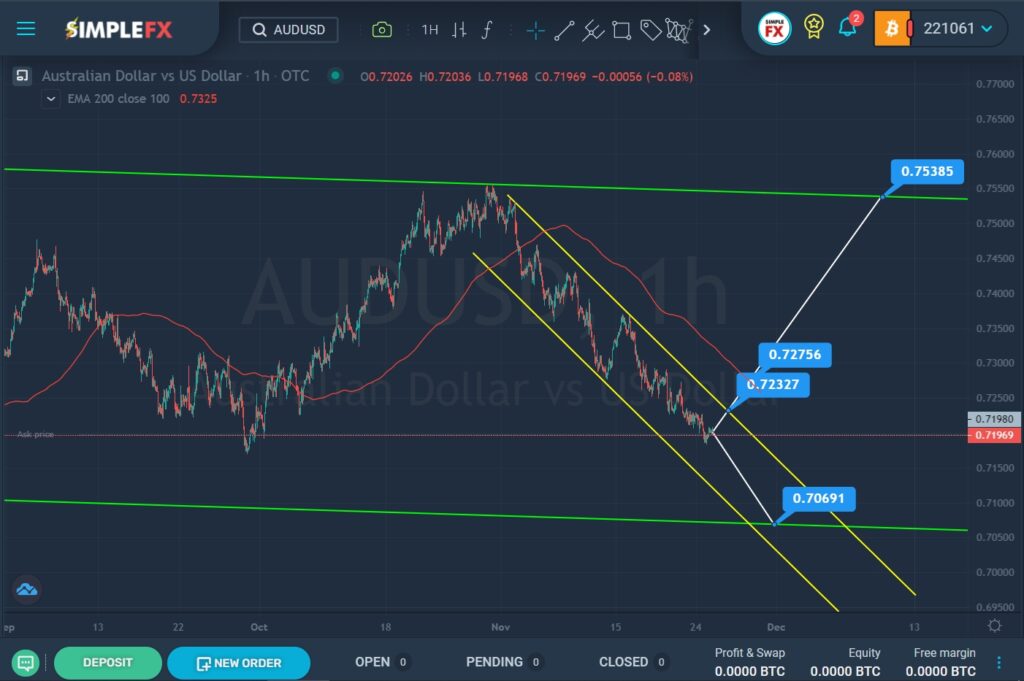
Today, for the AUDUSD currency pair, let’s look at the situation on the 1H timeframe, where the market movement has been visible since September of this year. Apparently, a downtrend is being built within a large green channel. We see that until November, the price was moving in an upward direction in a zigzag shape to the upper green line.

SimpleFX AUDUSD Chart Analysis: November 25, 2021
At the beginning of November, the market pushed off from the upper green line, and we saw a fairly rapid price drop within a small yellow channel. Now the price is approximately in the center of the yellow channel and in the lower green area.
There are two options for the development of events, the first option considers the continuation of the bearish movement to the lower green wall. It is possible that the price will drop to the support level of 0.706, which is located on the lower green line.
The second scenario suggests an upward movement to the upper yellow line and the resistance level of 0.737. If the bulls can break through this level, then market participants will continue to develop the bullish trend to the resistance level of 0.753, which is located on the upper green line. However, the resistance level of 0.727, which forms the red line of the moving average, is on the way for the bulls. This level can restrain the increase or slow it down for a while. The break of this level will confirm that the bulls really intend to reach the upper line of the green channel.


