


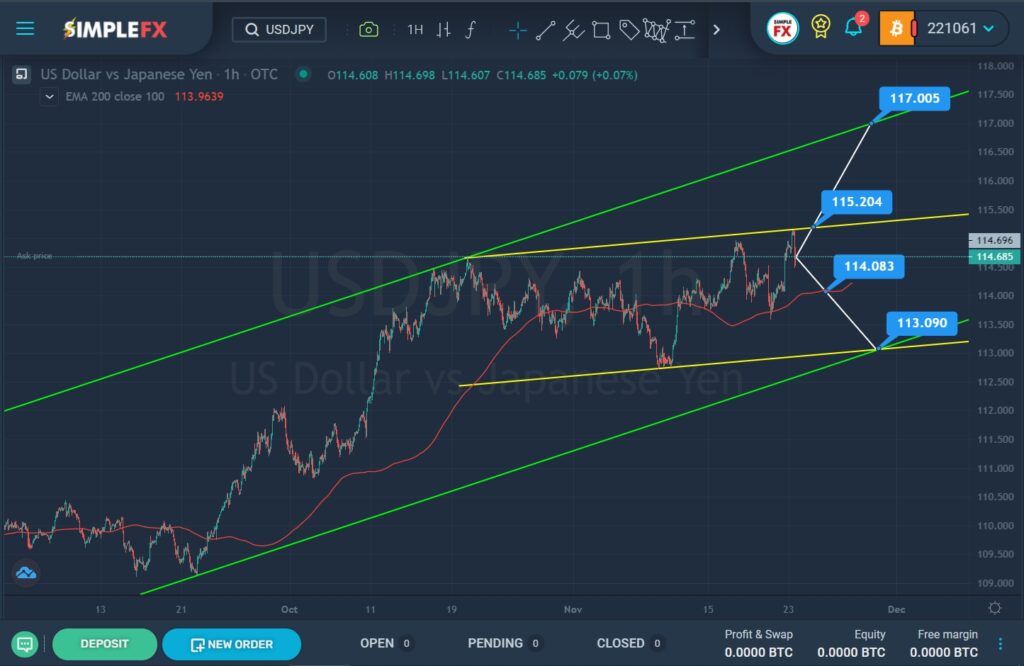
The current formation of the USDJPY currency pair assumes a global bullish trend that moves within the green channel.

SimpleFX USDJPY Chart Analysis: November 23, 2021
In the second half of September of this year, the price touched the lower green line and then began to rise impulsively. In the second half of October, the price reached the upper green line, then the market began to move sideways with a slight upward slope. It is possible that a correction is being formed, which is being built within the small yellow channel.
Currently, the price has come close to the upper yellow wall. If the bulls have enough strength to break through the resistance level of 115.20, which is located on this wall, then a path will open for them to the upper green line and the resistance level of 117.00.
Alternatively, a downward movement of the market is expected, as recently there was an attempt to break through the upper yellow wall, but the bulls did not have enough strength.
There is a red moving average line on the price path, which acts as a support line in this case. The break of the 114.08 level will serve as confirmation that the trend towards the lower lines of the yellow and green channels has begun. Thus, in the event of a break of this level, nothing will interfere with the bears to decline to the level of 113.09.


