


For the main EURUSD currency pair, we see the construction of a large downtrend that moves inside the green channel.

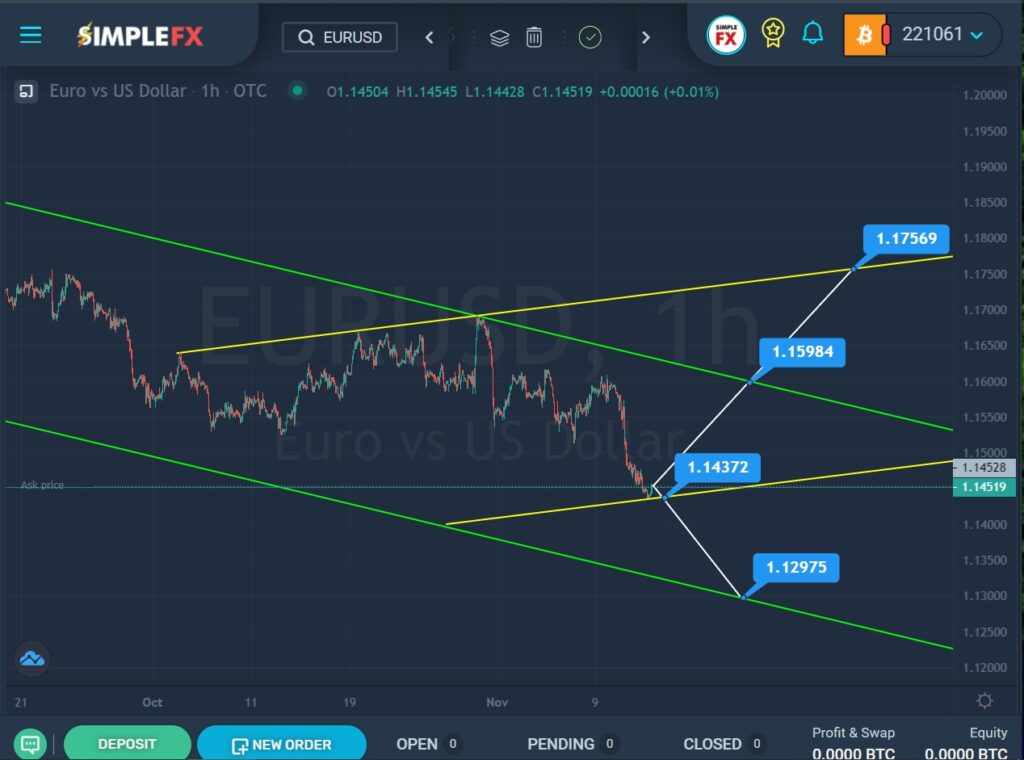
From October to November, the market moved in an upward direction from the lower green area to the upper green line within the ascending yellow channel. We see that the price reached the intersection of the two upper walls of yellow and green, then pushed off and began to go down.
Currently, the market is practically on the lower yellow line. Thus, it is likely that in the future the bears will break through the support level of 1.143, and then continue to lead the price to a lower support level of 1.129, which is located on the lower green wall.
However, if we look at the last section of the chart, we can see that the bears have already tried to break through the lower wall, but so far without success. Thus, it can be assumed that bulls will soon come to the market and start pushing the price up. The first target is located on the upper line of the green channel – the resistance level of 1.159. With a successful break of this level, the market growth can be continued to a higher resistance level of 1.175, which is located on the upper wall of the yellow channel.


