


The current structure of the American stock index DJI30 suggests the formation of a global uptrend that moves inside a large green channel. On the current chart, we see the price move from the end of August to the present day.

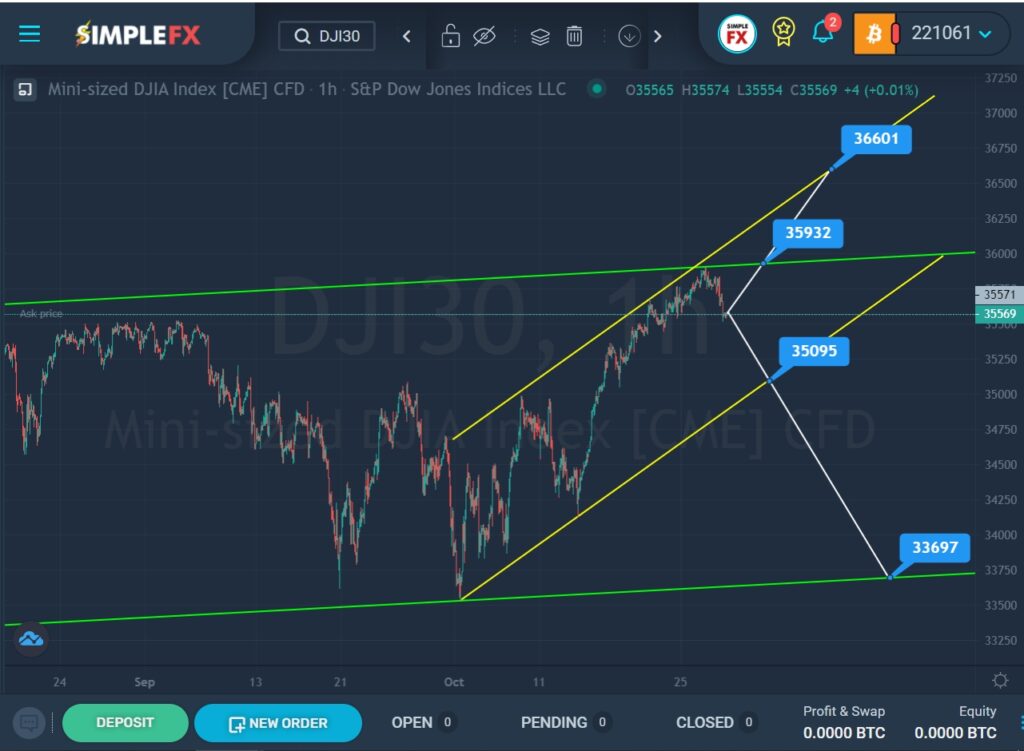
At the beginning of September, the price was in the upper green area for some time, after which we saw a rapid fall of the market to the lower green wall, and then, after a pullback from the lower green line, an equally rapid rise to the upper green line within a small yellow channel.
The bulls failed to break through the upper green wall the first time, so there is a chance that they will try to break through the resistance level of 35932 again. With a successful break of this price level, the way will open for the bulls to the upper yellow line and the resistance level of 36601.
However, it is worth considering an alternative scenario. According to this view, it is assumed that the bulls have lost their strength since they have held their positions for the last month. In this case, bears will enter the market! Perhaps the price will drop to the support level of 35095, which is located on the lower line of the yellow channel. With a successful break of this level, we should expect the continuation of the downward trend in the direction of the support level 33697, which is on the lower green line.
We will continue to observe the behavior of the index.


