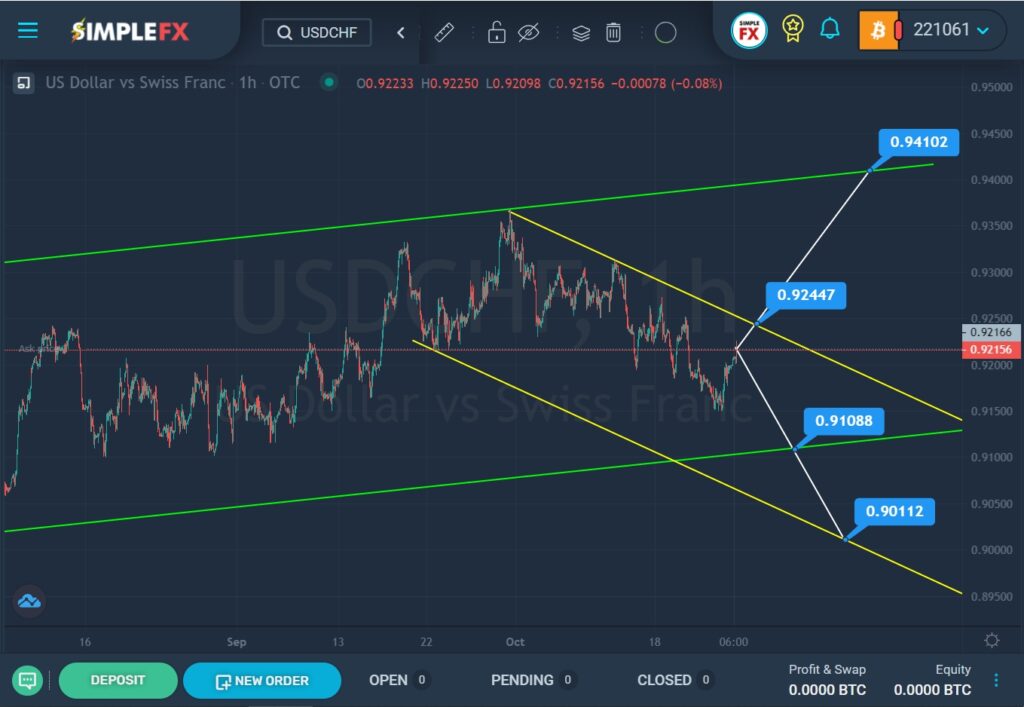
The current structure of the USDCHF currency pair suggests the formation of a global uptrend that moves inside a large green channel. The 1H timeframe shows the period of market move from mid-August to the present day.

At the beginning of this month, the price reached the upper green line, then pushed off from it and began to move in a downward direction. The last section of the chart describes a small yellow channel.
Currently, the price is close to the upper yellow line and the resistance level of 0.924. It is likely that the bulls will gather their strength and push in the near future and it is possible that they will be able to break through the specified price level. If the level of 0.924 breaks, the price may continue to rise in the direction of a higher resistance level of 0.941, which is located on the upper green line. In the current situation, it is possible to consider opening long positions.
Alternatively, market participants can expect a downward movement of the currency pair in the direction of the lower yellow wall and the support level of 0.910. It is possible that bears will be able to break through this level and then the price will drop to the lower yellow wall and the support level of 0.901. In such a situation, it is recommended to consider opening sales transactions.