


The formation of the USDCAD currency pair suggests the construction of a global downtrend that moves inside a large green channel. The 1H timeframe shows a section of the market move since the end of July this year.

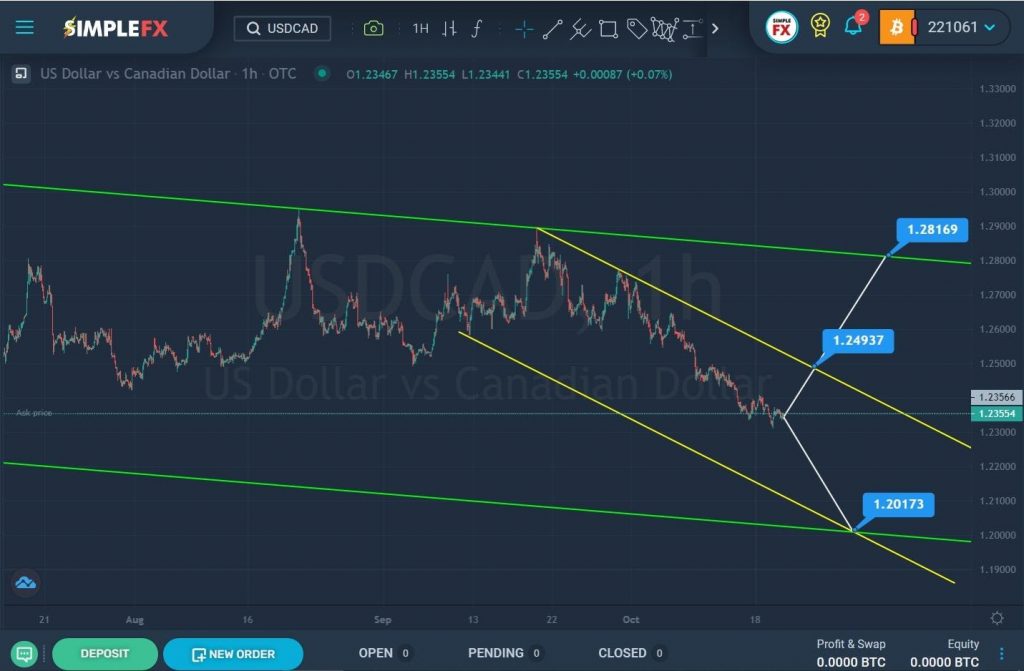
In the last section of the chart, we see a downward movement of the price from the upper green area in the direction of the lower green wall within the yellow channel. Not so long ago, the market pushed off from the upper yellow wall and began to move down. So far, the bulls have failed to break through the upper yellow line. There is a chance that the bulls will try their luck again. When the resistance level of 1.249 breaks, a path will open for them to the upper green line and the resistance level of 1.281.
Alternatively, a downward movement of the price is expected to the lower green wall and the support level of 1.201. This price level is at the intersection of the two lower lines of the green and yellow channels.
It is preferable to add this pair to our watchlist!


