


It’s been quite a time since Litecoin fell out of the top 10 cryptos by market cap, but the token is not dead at all. LTCUSD has an interesting price action with strong price swings. Where is the current trend going? Take a look at our chart analysis.
In the second part, we’ll take a look at the future of Nikkei 225. The Japanese index crashed this week into a correction zone.

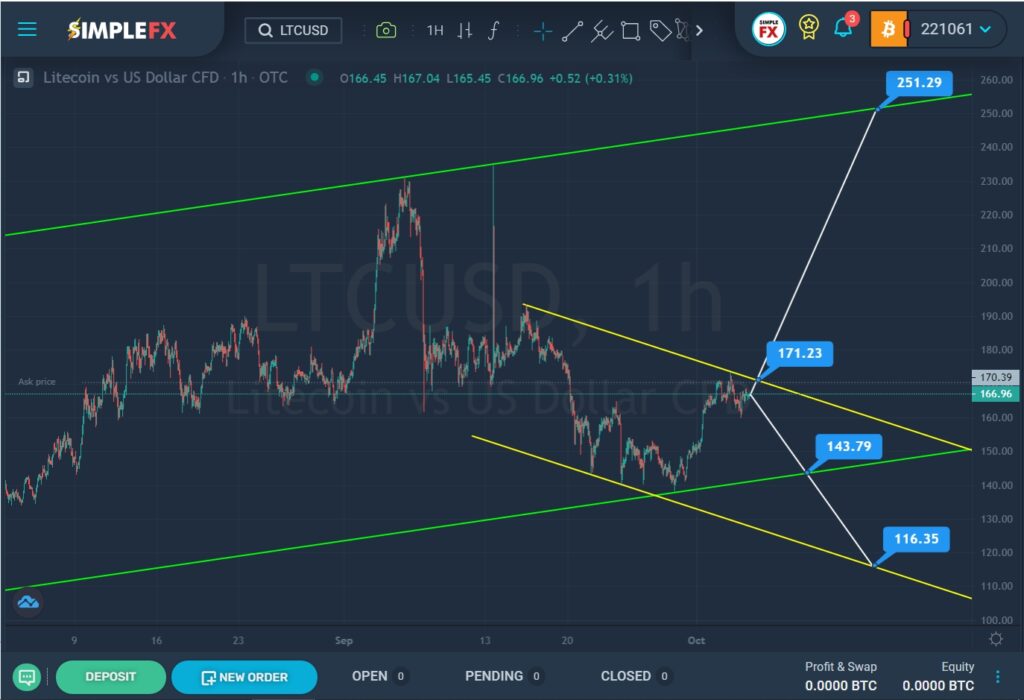
SimpleFX LTCUSD Chart Analysis: October 5, 2021
For Litecoin, we see the formation of a global uptrend that moves within the green channel.
Over the past month, the price has been moving in a downward direction from the upper green line to the lower green line inside a small yellow channel. Not so long ago, the market pushed off from the lower green line, and in a short period of time reached the upper line of the yellow channel. In case of a successful break of the upper yellow wall near the resistance level of 171.23, market participants may expect a long upward price move in the direction of the resistance level of 251.29, which is on the upper green line.
Alternatively, the cost is expected to decline again to the lower green line. If the bears break through the support level of 143.79, then they will open the way to the next support level of 116.35, located on the lower yellow wall.

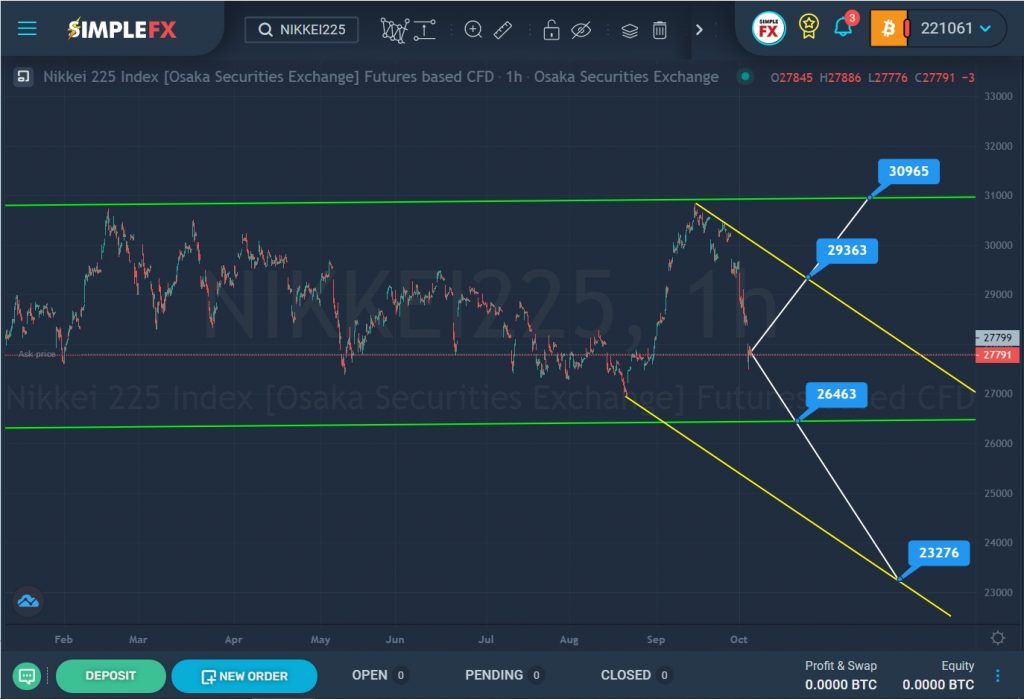
SimpleFX NIKKEI225 Chart Analysis: October 5, 2021
The NIKKEI225 stock index suggests the formation of a large horizontal correction, which moves within the green channel with a slight upward bias.
Recently, the price reached the upper green line, however, the bulls were unable to break through the resistance line, so the market pushed off and began to move down.
If we look at the last section of the chart, we can notice a rapid decline in the market within the descending yellow channel. It is possible that the decline will continue at the same pace in the direction of the lower green line and the support level of 26463. If this level breaks, the decline can be continued to a deeper support level of 23276, located on the lower yellow line.
Alternatively, it is assumed that the price may begin to rise to the upper yellow wall and the resistance level of 29363. In case of a break of this level, the growth may continue even higher to the upper green line and the resistance level of 30965.


