
Ethereum’s on the rise and already gained around 8% on SimpleFX. This is great news for the users who deposited their ETH in our Stake&Trade accounts. Let’s have a look at the newly formed channels.
In the second part of our Friday post, we will examine BMW stocks. Automotive globally is dealing with big challenges – rising inflation and logistic uncertainties with China production output shortages.
SimpleFX ETHUSD Chart Analysis: October 1, 2021
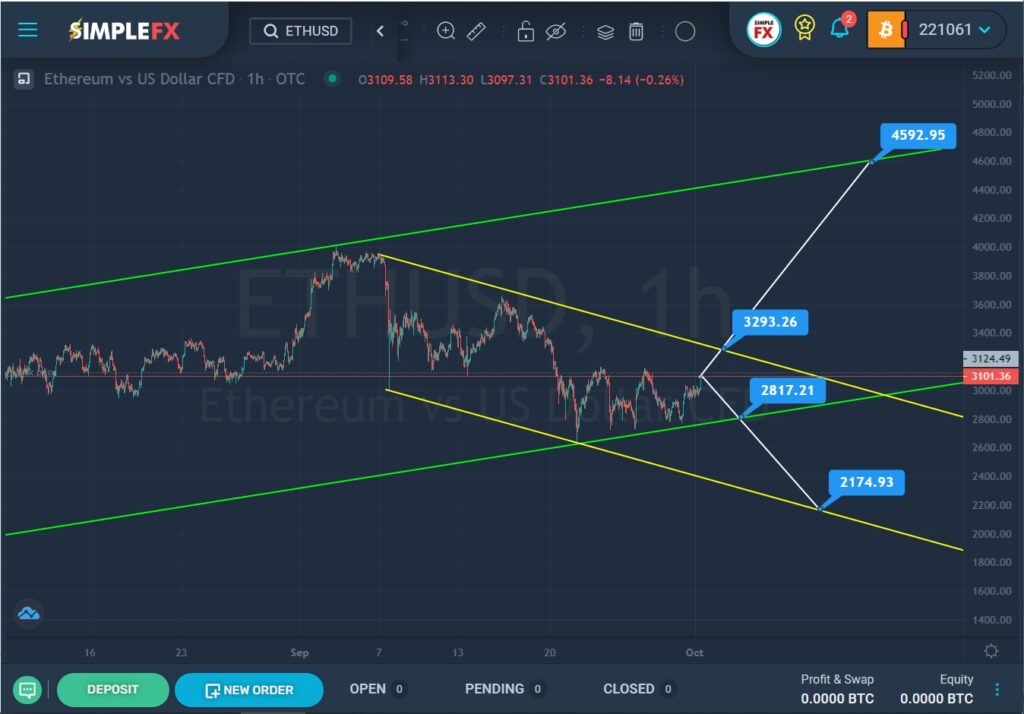
For the ETHUSD cryptocurrency pair, we see the formation of an uptrend that moves inside a large green channel. Most cryptocurrency prices are going up recently.
In early September, the price touched the upper green line, then pushed off from it and began to move down within the yellow channel. Not so long ago, the bears reached the lower green line at the intersection with the lower yellow wall, but they did not have enough strength to lead the market further. However, the bulls are not so strong either, as the price is still in the lower green area.
It is assumed that if the market reaches the resistance level of 3293.26, which is on the upper yellow line, then there will be a chance for bulls to break ahead and push the price to the upper green wall and the resistance level of 4592.95.
Alternatively, a repeated decline to the lower green line is expected. With a successful break of the support level of 2817.21, the bears will open the way to the lower yellow line and the resistance level of 2174.93.
SimpleFX BMW.DE Chart Analysis: October 1, 2021
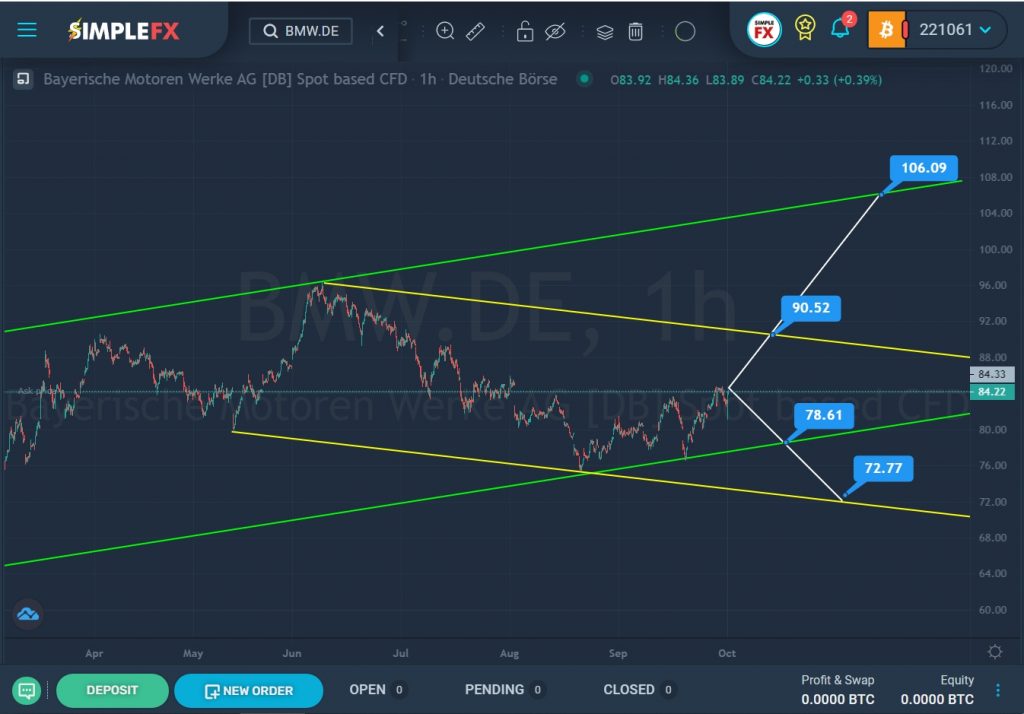
The BMW.DE stock chart shows a bullish trend that moves within a large green channel.
At the beginning of June, we saw how the price pushed off from the upper green line and smoothly began to decline to the lower green line within a small yellow channel.
During the last month, the price has been in the lower green area. It is assumed that the bears will find the strength and break through the support level of 78.61, since there has already been more than one attempt to do this. With a successful break of this level, the price may drop to the lower yellow wall and the support level of 72.77.
Alternatively, an upward wave is expected to develop. The price may rise to the upper yellow line and the resistance level of 90.52. If the bulls have enough strength to break through this level, the upward wave will continue its development to the next resistance level of 106.09, which is on the upper green wall.