
Dollar and pound sterling have both gained some traction in the forex market. Let’s take a look at how far they can go.
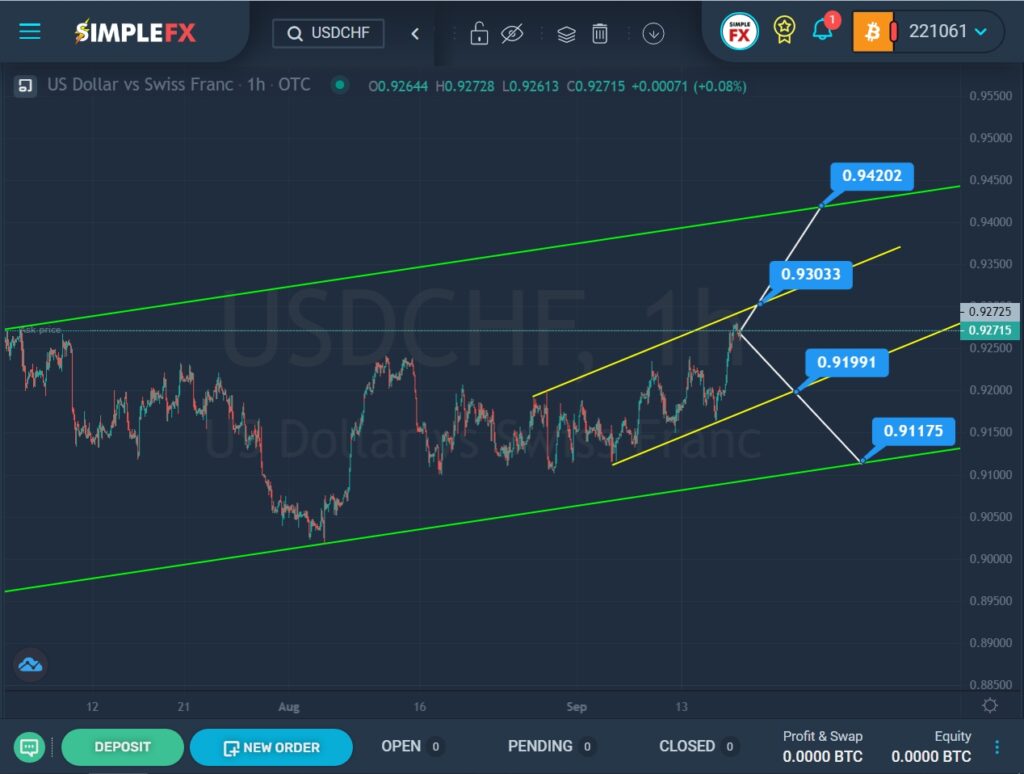
We see the construction of an uptrend that moves inside a large green channel.
A month and a half ago, the price reached the lower green line, then pushed off from it and began to move sideways. The last section of the chart describes a small yellow channel.
Currently, the price is close to the upper yellow line and the resistance level of 0.930. If that level is broken, the price may continue to rise in the direction of the resistance level of 0.942, which is on the upper green line.
Alternatively, the market is expected to move downward in the direction of the lower yellow wall and the support level of 0.919. If this price level is broken, the price may continue to fall to the support level of 0.911.
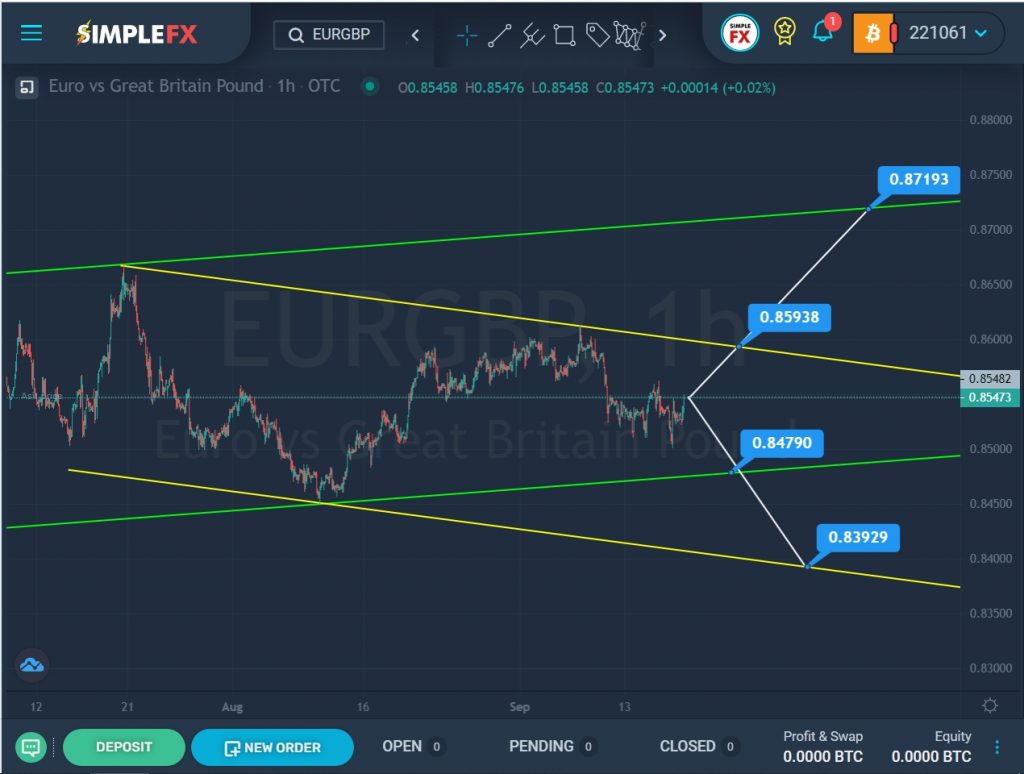
The current formation of the EURGBP pair suggests the construction of an uptrend that moves within the ascending green channel. However, there is a possibility that at the end of July, when the price pushed off from the upper green line, the market began to build a new bearish trend that moves inside the yellow channel.
To confirm the downtrend, we should see the price decline to the support level of 0.847, which is on the lower green line. If this level is broken, we will see the price decline to a lower support level of 0.839, located on the lower yellow line.
If the bullish trend continues to form, market participants can expect the price to rise to the resistance level of 0.859, which is on the upper yellow line. If this level is broken, the bulls will continue to push the price up to the resistance level of 0.871, located on the upper green line.