


The Canadian dollar had just entered a critical point from the technical analysis perspective. Seems like a good moment to act. In the second part of the post, we take a look at the NDX100 index. Tech companies have gone through a downturn recently, but in the longer run, bullish signs are quite convincing.
Trade USDCAD, NDX100, or any other assets and receive $1,000 at the end of September. Everyone can join in SFX reward center.

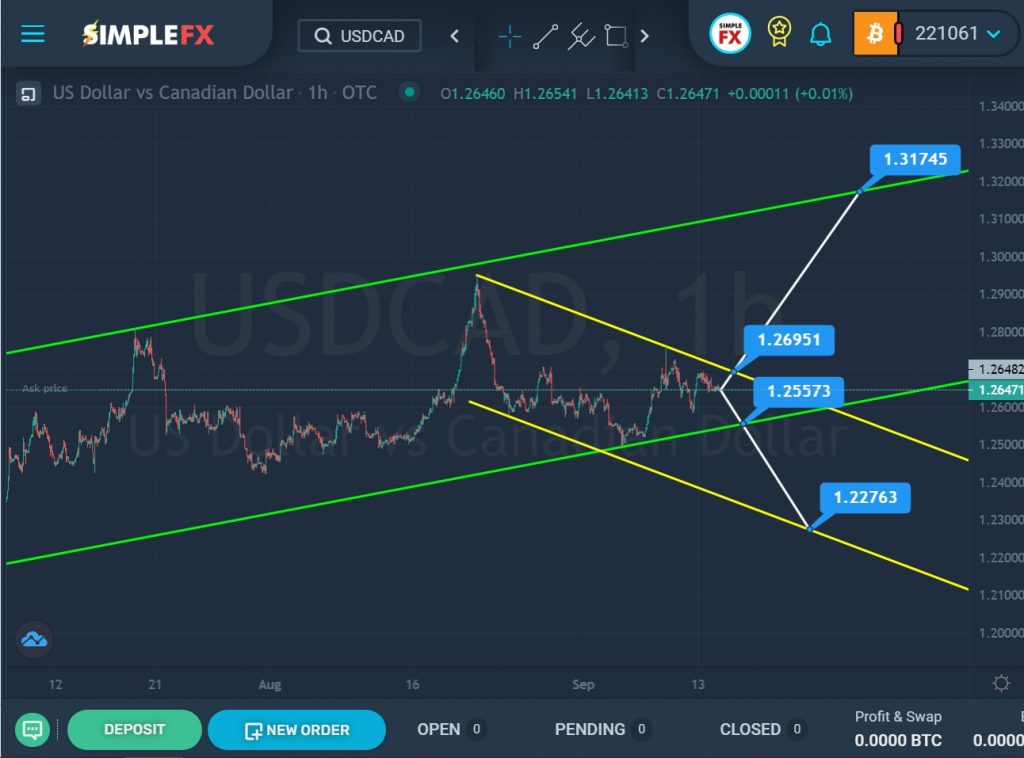
SimpleFX USDCAD Chart Analysis: September 14, 2021
The formation of the USDCAD currency pair suggests the construction of an uptrend that moves inside a large green channel.
In the last section of the chart, we see a downward move of the price from the upper green area to the lower green wall within the yellow channel. Not so long ago, the market pushed off from the lower green wall and began to move up. So far, the bulls have not managed to break through the upper yellow line. There is a possibility that the bulls will try their luck again. If the resistance level of 1.269 breaks, a path will open for them to the upper green line and the resistance level of 1.317.
Alternatively, a downward move of the price is expected to the lower green wall and the support level of 1.255. With a successful break of this price level, the price decline can be continued to the lower yellow line and the support level of 1.227.

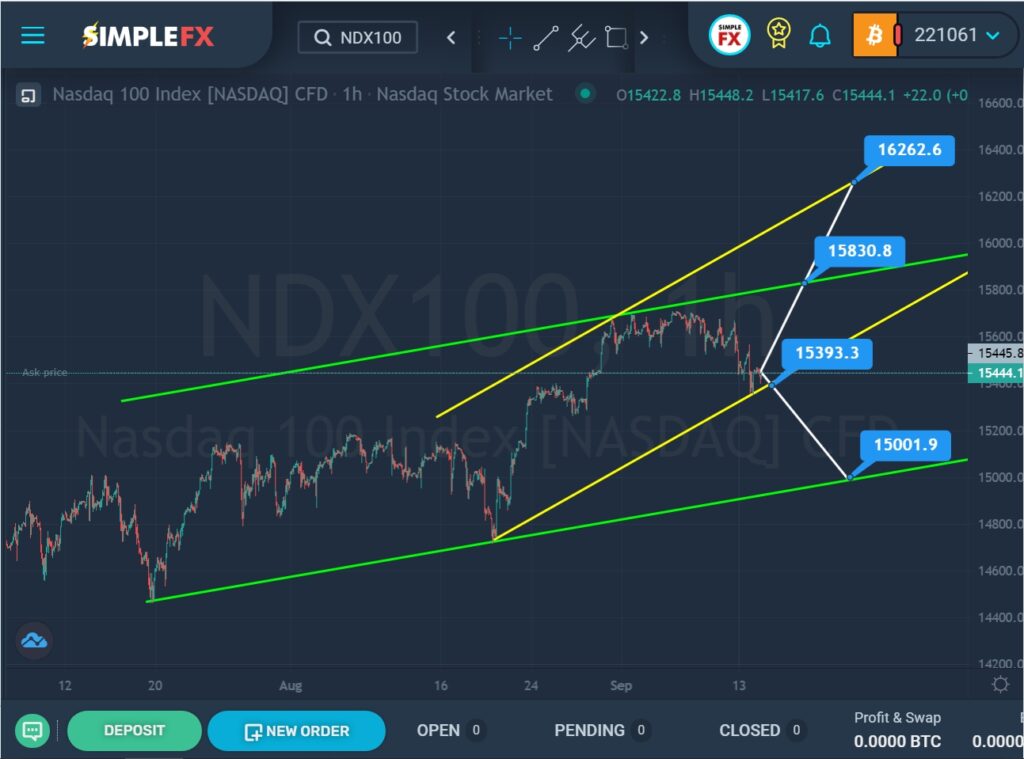
SimpleFX NDX100 Chart Analysis: September 14, 2021
The NDX100 stock index suggests the formation of a bullish trend that moves inside the green channel.
At the end of August, the price reached the lower green line, pushed off from it, and began to rapidly rise to the upper green line within the yellow channel. In early September, the price touched the upper green line, but could not break through it.
Currently, the market is near the lower yellow line near the support level of 15393.3. If this level is broken, the market is expected to continue falling to a lower support level of 15001.9, which is on the lower green line.
However, if the bears cannot break through the support level of 15393.3, the market will push off from the lower yellow wall and continue to move in an upward direction. The first target is at the resistance level of 15830.8, which is on the upper green line. If the bulls are strong enough, they will be able to break through this level and continue to push the price in the direction of the resistance level of 16262.6, which is on the upper yellow wall.


