
If you are bullish on long-term oil prices, you may have to wait for a strong rally. If you think the opposite, selling high on this retracement may be a good idea. There are lots of uncertainties in the global economy, which also creates some appreciation room for safe-haven currencies, such as JPY, which we discuss in the second part of our early-week analysis.
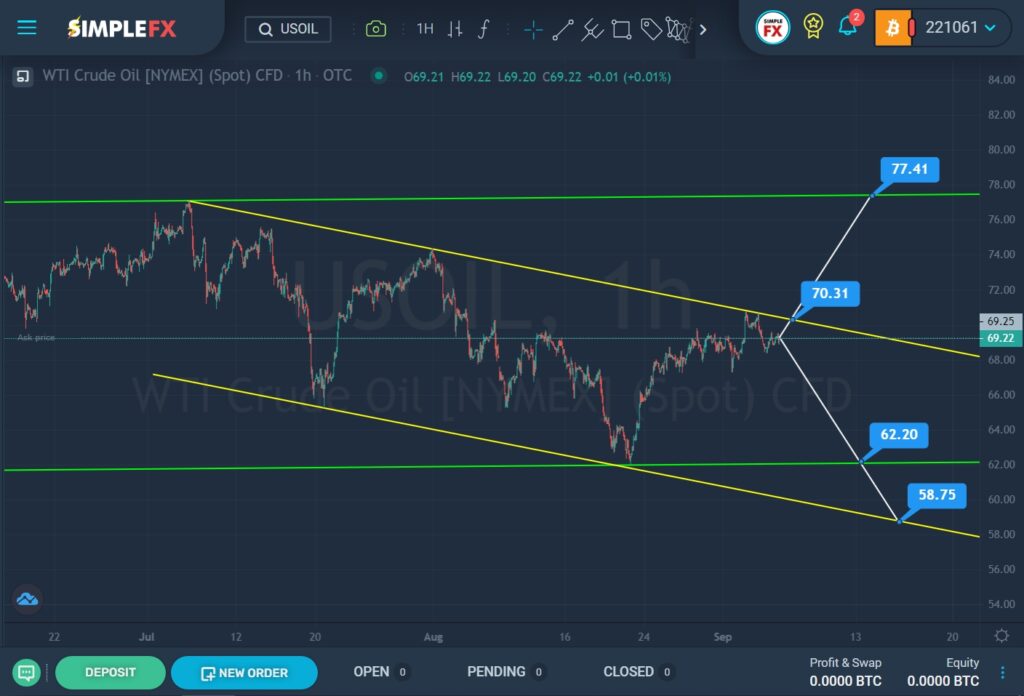
The current USOIL structure hints at the development of a large bullish trend, which is being built inside the green channel.
Since the beginning of July, the market has been moving in a downward direction from the upper green wall to the lower green wall within the yellow channel. Recently, the price pushed off from the lower green line and began to rise rapidly.
In the last section of the chart, we see that the price is close to the upper yellow wall. It is possible that soon the bulls will break through the resistance level of 70.31, and then lead the market to a higher resistance level of 77.41, which is on the upper green wall.
Alternatively, a bearish market move is expected in the direction of the lower green line and the support level of 62.20. If this level is successfully broken, the price may fall to the lower yellow wall and the support level of 58.75.
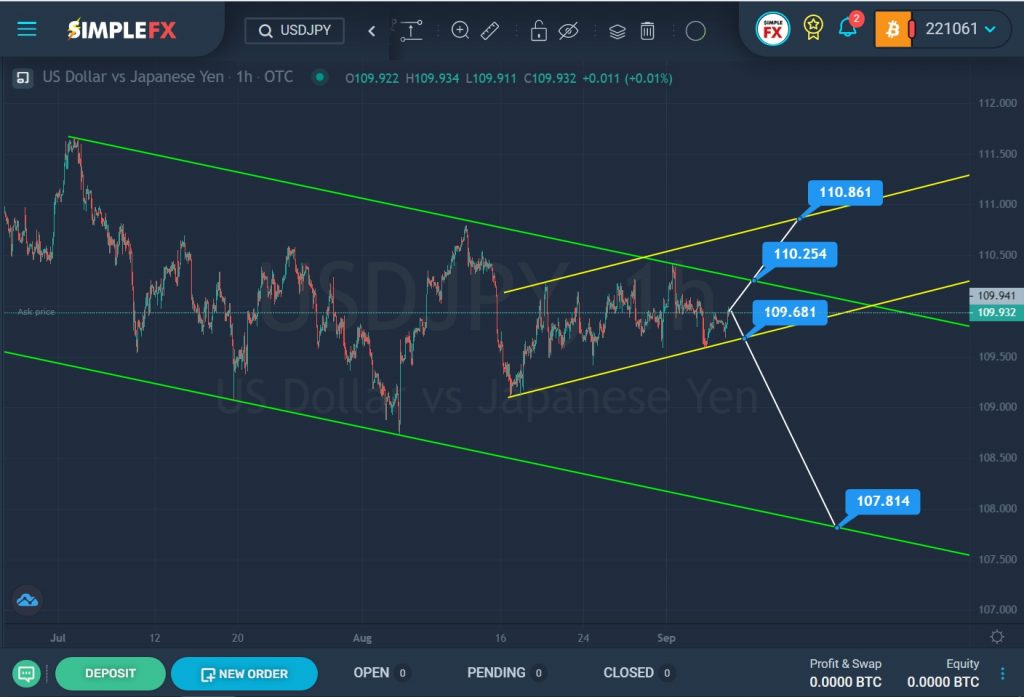
For the USDJPY currency pair, we see the formation of a downtrend that moves within the green channel.
In the second half of August, the price decline was suspended, we saw a market reversal and the beginning of growth in the direction of the upper green wall. This section describes a small ascending channel.
Perhaps in the near future we will see how the bulls break through the resistance level of 110.25, which is on the upper green line. After the break of this price level, the price will continue to rise to the next important resistance level of 110.25.
However, it is possible that the price may reach the support level of 109.68, located on the lower yellow wall, as it is currently very close to it. If this level is broken, the bears will be able to take the initiative and send the market to the lower green line and the support level of 107.81.