


U.S. stock futures moved mostly uneventfully on Friday as traders awaited key data about jobs in an economy that has been heating up or cooling down amid a resurgence of COVID-19 cases. The July jobs report will be today, a factor of particular interest given the improvements in labor.
DJI30 may break out of the side drift today, let’s take a look at the technical signals for the index.
In the second part of our Friday analysis, we wonder if EURJPY should slide even lower.

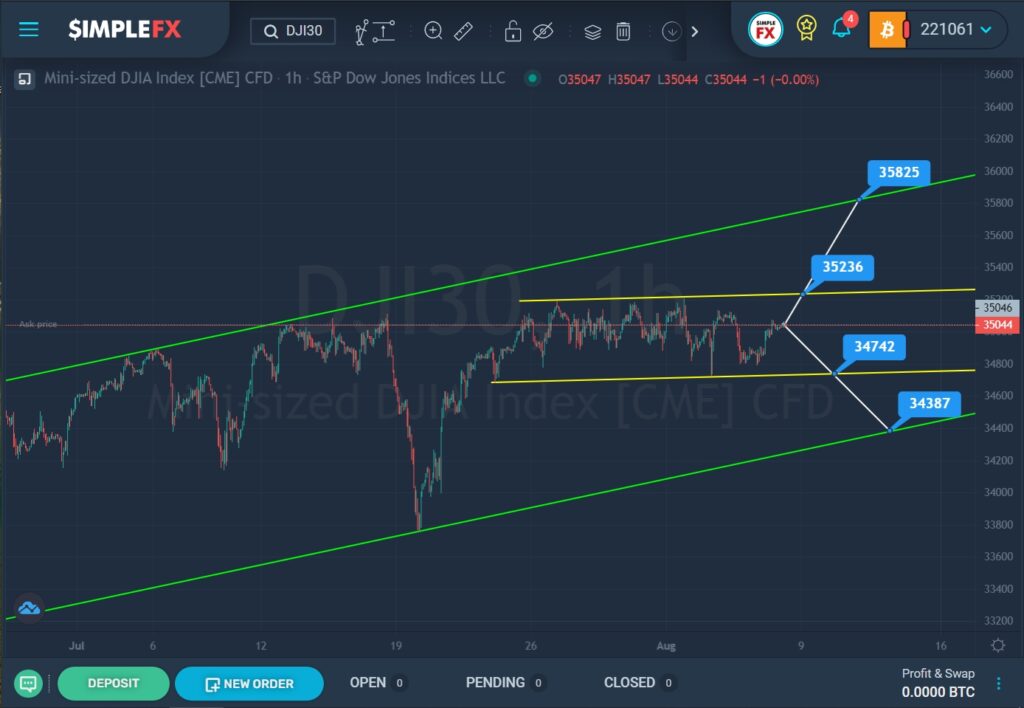
The formation of the DJI30 index shows the development of a bullish trend that moves inside a large green channel.
In the first half of July, the price moved in the upper green area, then we saw a sharp drop in the market to the lower green wall, and after the same sharp jump up.
In the last section of the chart, we see a repeated decline in the market within a small yellow channel. Perhaps, if the bulls can break through the upper yellow line near the resistance level of 35236, the price will rise to a higher resistance level of 35825, located on the upper line of the green channel.
However, bears also have a chance to take over the market. If they manage to bring the market to the lower yellow line, and then break through the support level of 34742, then a path will open for them in the lower green wall and the support level of 34387.

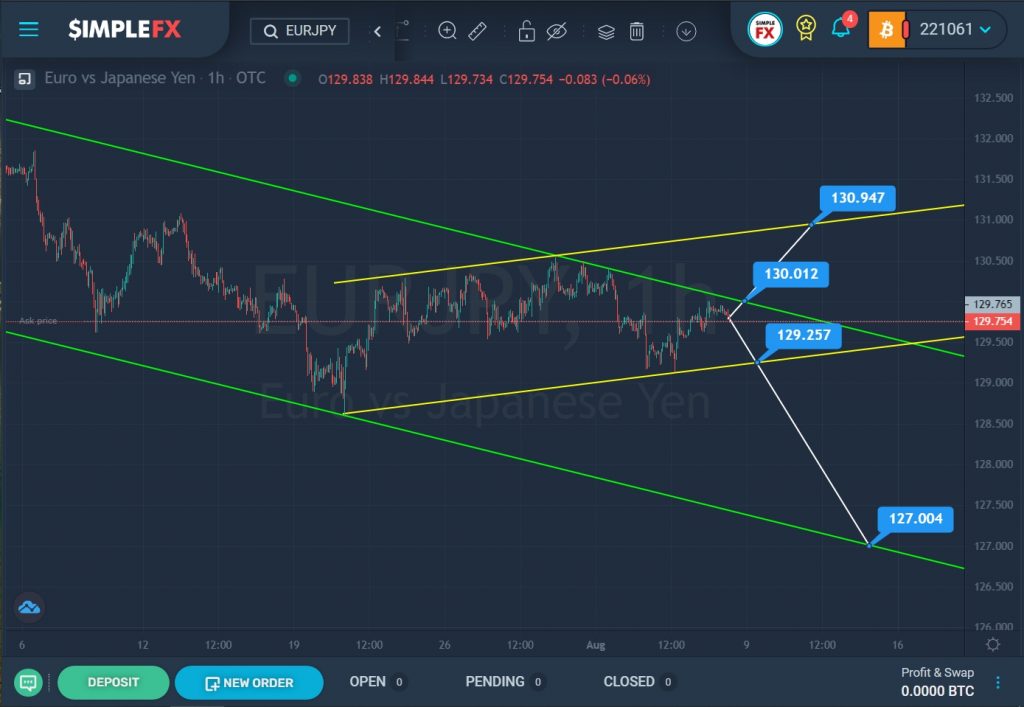
The formation of the EURJPY currency pair suggests the development of a downtrend that moves inside a large green channel.
The last section of the chart, where we see an upward price move from the lower green line to the upper green line, describes a bullish yellow channel.
Not so long ago, the price touched the upper wall at the intersection of the upper lines of the two channels, and then pushed off and began to decline. However, it is possible that the bulls will continue to push the price up. When the resistance level of 130.01 is reached, which is on the upper green line, and then its breakdown, the bulls will continue to move to a higher resistance level of 130.94, located on the upper yellow wall.
The second scenario suggests a bearish market move. The first target is at the support level of 129.25, which is on the lower line of the yellow channel. If this level is broken, the bears will open the way to the lower green line and the support level of 127.00.


