

U.S. stocks futures are in the red at the moment as Amazon disappointed investors with their results. We have prepared a Nasdaq technical analysis for you. Read it carefully before the trading starts.
In the second part of our Friday technical outlook, we once again examine the trading opportunities behind USDCAD as the US dollar weakens against all major currencies.
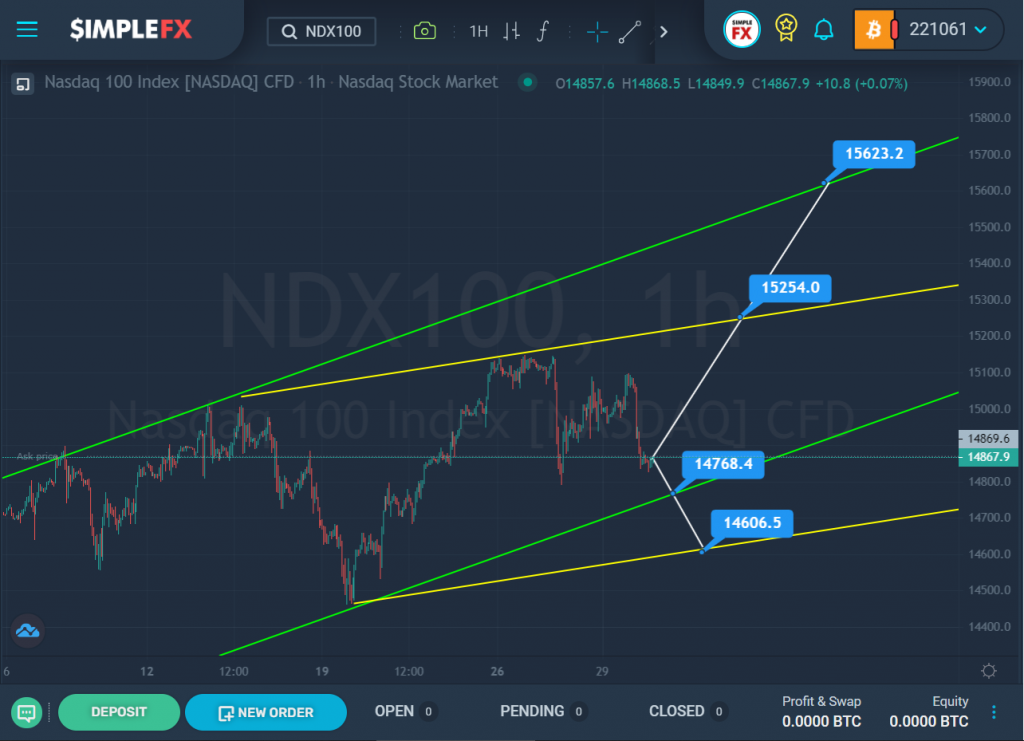
The NDX100 stock index hints at the formation of a large uptrend that moves inside the green channel and inside the yellow channel, which describes the last section of the chart for two weeks.
Not so long ago, the price went down to the lower green wall and then pushed off from it. After that, the market began to slowly rise in the direction of the upper yellow wall, then the price pushed off from it and went down again.
It is possible that the bears will soon bring the market to the support level of 14768.4, which is on the lower green wall. If this level is broken, they will open the way to the lower yellow line and the support level of 14606.5.
In the second option, the price may rise again to the upper yellow wall and the resistance level of 15254.0. If the bulls overpower this level and break through it, then they will open the way to the upper green wall and the resistance level of 15623.2.
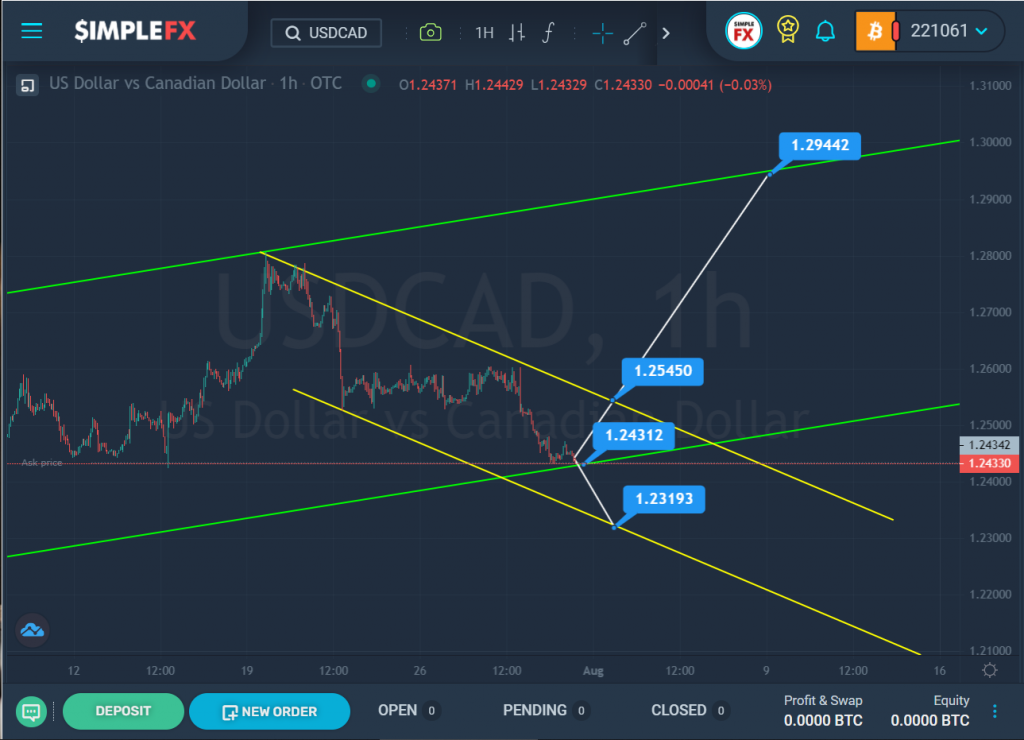
The USDCAD currency pair shows the construction of a global uptrend that moves inside the green channel.
Recently, the market pushed off from the upper green wall and began to move down within the descending yellow channel. Currently, the price is near the support level of 1.243, which is on the lower green line. If this level is broken, the price may fall to the lower yellow wall and the support level of 1.231.
Alternatively, the price may push off from the lower green line and start moving up. If the bulls have enough strength to break through the resistance level of 1.254, which is on the upper yellow line, then they will open the way to a higher resistance level of 1.294, which is on the upper line of the green channel.