
This blog post will help you understand the current AUDUSD market and GBPJPY’s direction. I have analyzed both cryptos to provide a detailed analysis of how they are performing in comparison to each other.
The AUDUSD is may be oversold, which means it has been dropping for some time and is likely due for a short-term reversal at this point.
On the other hand, GBPJPY has been trending sideways with no major changes, but we might see some signs of a downtrend. The lack of a strong trend makes it more difficult to predict where the pair will go next because its movement tends to be slow and gradual so there isn’t much momentum or force behind its movements.
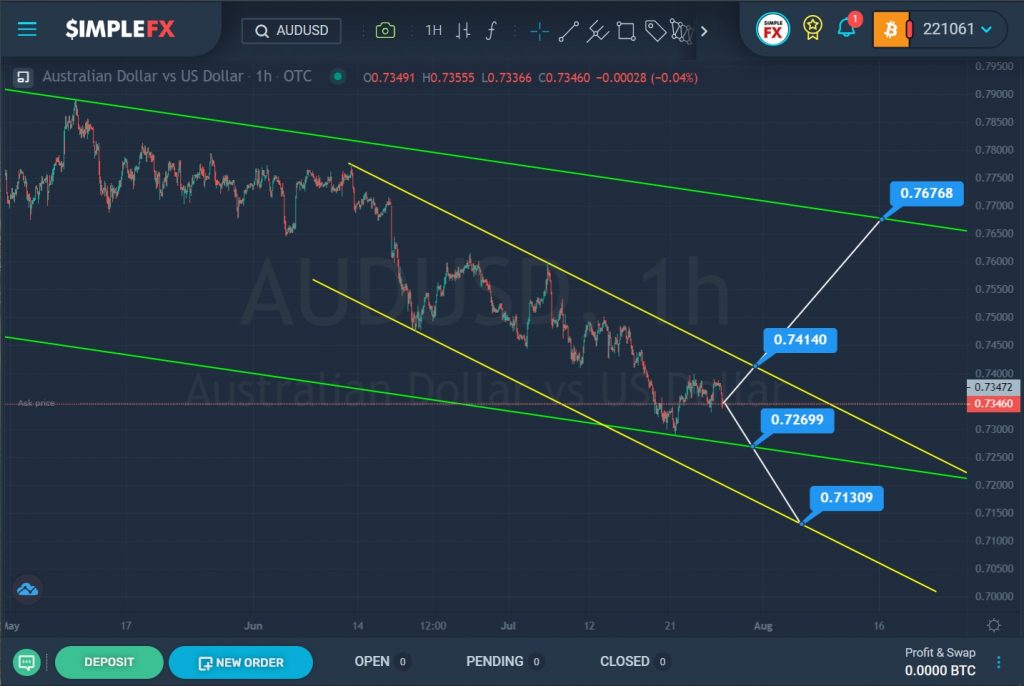
The AUDUSD currency pair forms a large bearish trend that moves inside the descending green channel. The last section of the chart, where we see a bearish move from the upper green line to the lower green line, describes a yellow channel that is smaller in size.
Recently, the market pushed off from the lower wall of the green channel and began to move up. It is possible that the bears will try again to break through the lower green line. This scenario will be confirmed in the event of a break of the support level of 0.726. In this case, the market may decline to a lower support level of 0.713, which is on the lower yellow line.
Alternatively, the upward movement is expected to continue to the resistance level of 0.741, which is located on the upper yellow line. If the bulls can break through this level, they will open the way to a higher resistance level of 0.767, which is on the upper green line.
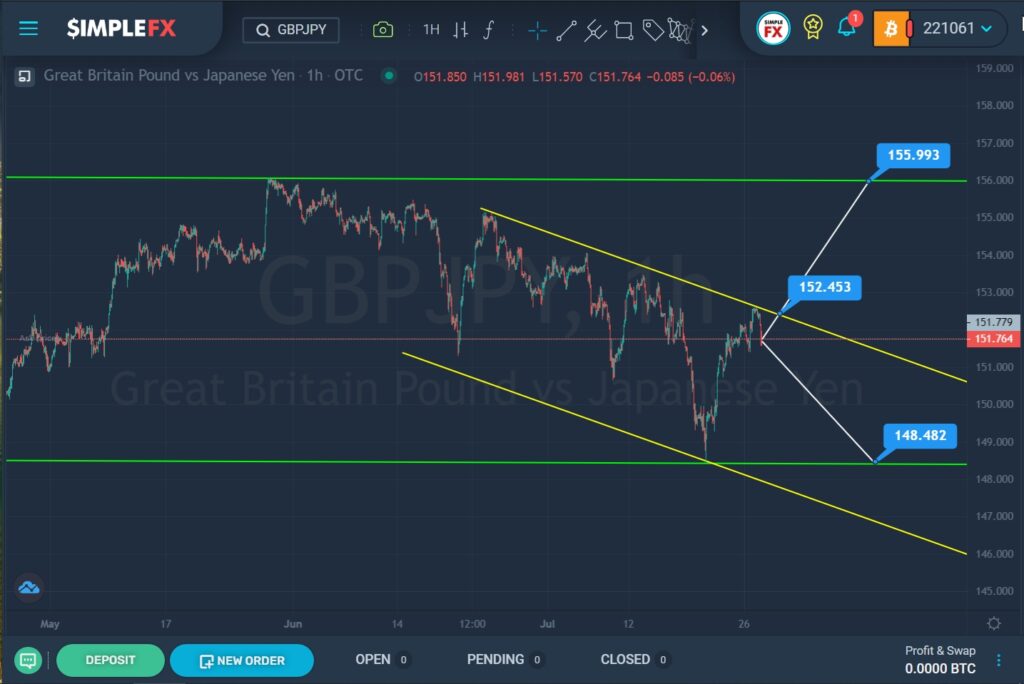
We see the construction of a large horizontal trend with an upward slope. Over the past two months, the market has been moving down from the upper wall to the lower wall of the green channel.
The last section of the chart describes a descending channel of yellow color. Most likely, the market will move up in the next coming trading days. If the resistance level of 152.45, located on the upper yellow line, breaks, the price may rise to the resistance level of 155.99, which is on the upper green line.
If the upper yellow line is not broken, then we can expect the depreciation of the GBPJPY pair in the direction of the support level, which is on the lower green line.
We will continue to observe the behavior of the price further.