


USOIL is one of the most exciting assets recently. The price swings are impressive as no one can predict the mid-term future of the global economy, and the recovery of international trade and travel. We analyze the chart for you.
In the second part take a look at the outlook of USDJPY as the Tokyo Olympics start today.

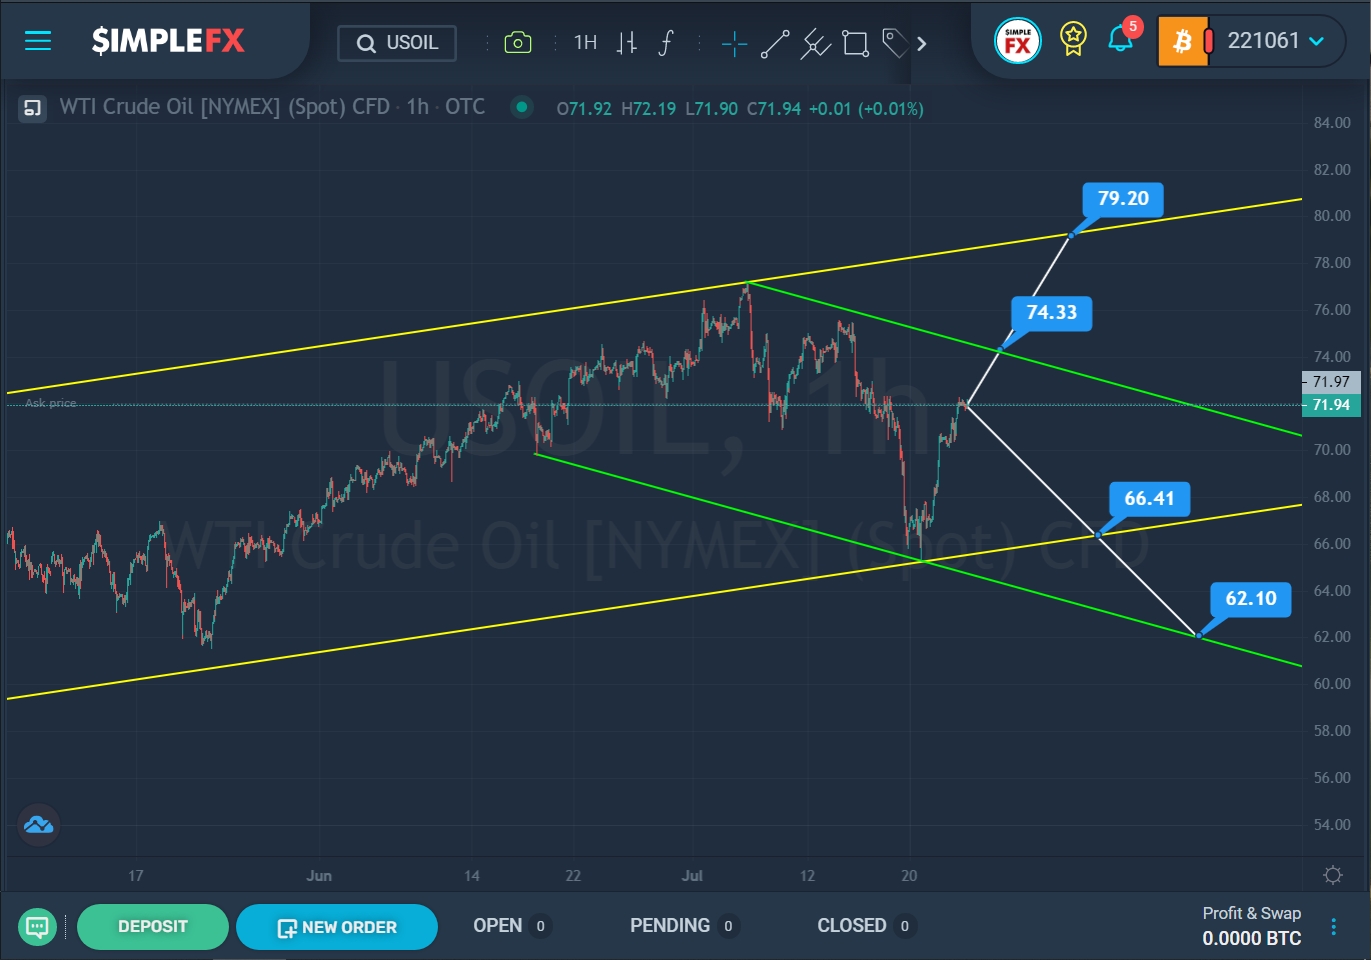
The current USOIL structure hints at the development of a large bullish trend, which is being built inside the yellow channel.
We see that not so long ago the price reached the upper yellow wall, then pushed off from it and began to decline sharply. In the last section of the chart, we see a downward move within a small green channel.
A few days ago, the price fell to the intersection of the two lower lines of the yellow and green channels, after which we saw a rapid rise. Most likely, the market growth will continue in the near future. The first target is located on the resistance line of the green channel-the level of 74.33. If this level is broken, the price can rise to the next important level of 79.20, which is on the upper yellow wall.
Alternatively, market participants may expect a bearish price move in the direction of the support level of 66.41. If this level is broken, USOIL may devalue to the level of 62.10, which is on the support line of the green channel.

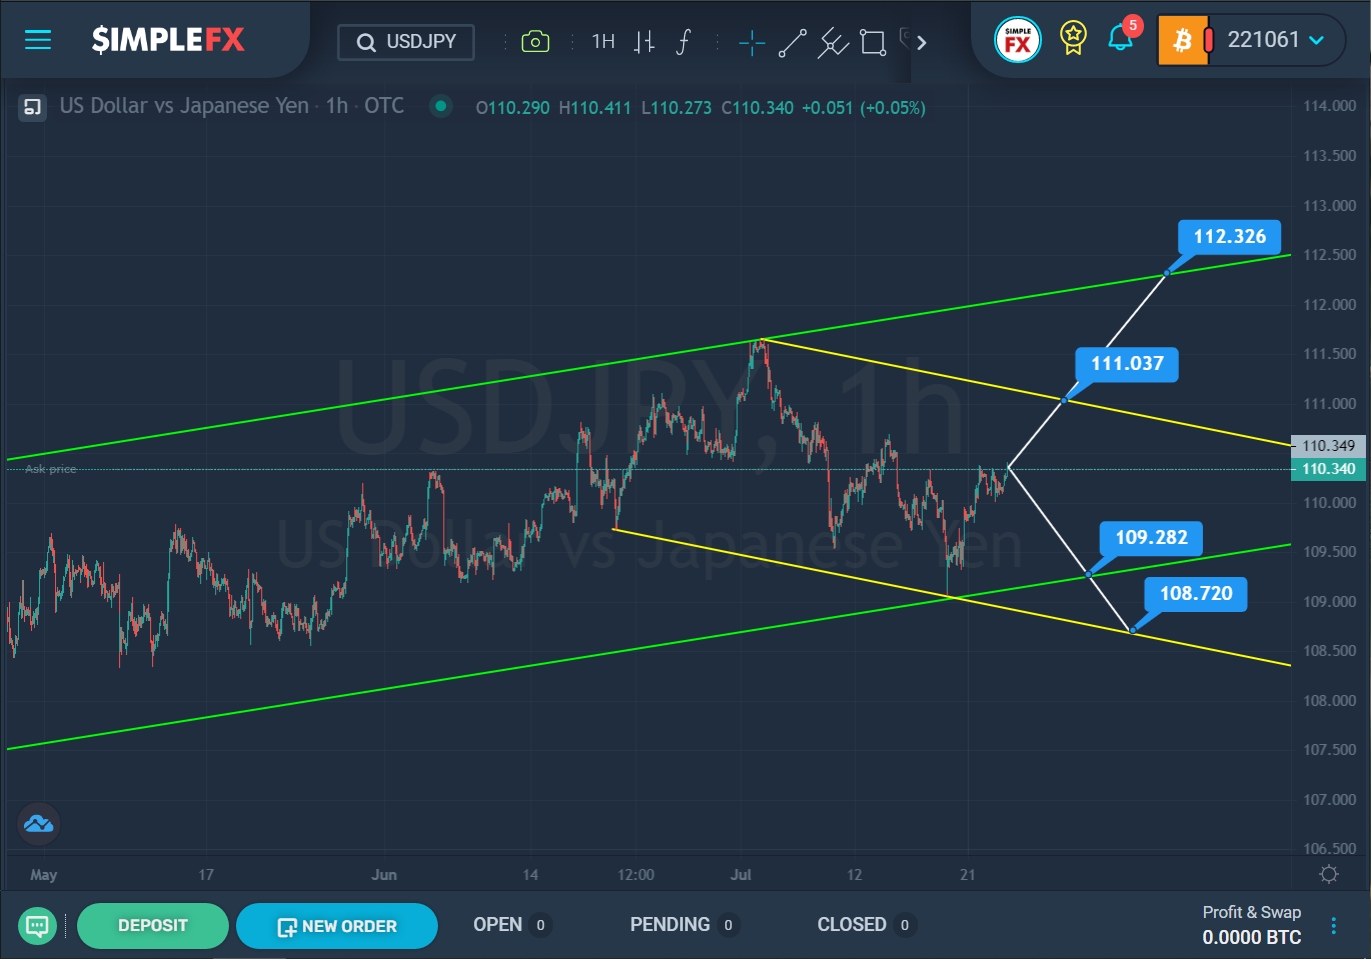
The upward trend continues to develop for the USDJPY currency pair, as in the previous trading weeks. The market is moving within the green channel. At the beginning of this month, the price touched the upper green line, however, the bulls did not have enough strength to break through it, so the market turned around and began to decline within the descending yellow channel.
Perhaps there was a small price adjustment, and the market will continue to grow again, since the price quickly reached the lower lines of the two channels, but then began to grow again. If this is the case, then it is worth waiting for the continued growth of USDJPY. In the near future, the market may reach the resistance level of 111.03, located on the upper yellow line. If this price level is broken, the way will open for the bulls to the next important resistance level of 112.32, which is on the upper green wall.
We should not rule out an alternative scenario, in which it is assumed that the bears are still full of strength and are ready to continue moving down. Most likely, they will be able to bring the market to the support level of 109.28, which is on the lower green line, and then break through this level and bring the market to the next support level of 108.72, which is on the lower yellow line.


