
It’s been tough recently for the US stock market. Dow Jones fell 700 points yesterday on fears of the new Covid wave. What does the technical outlook tell us in this exciting crossroad situation? Let’s have a look.
In the second part of the post, we’ll take a look at XAUUSD.
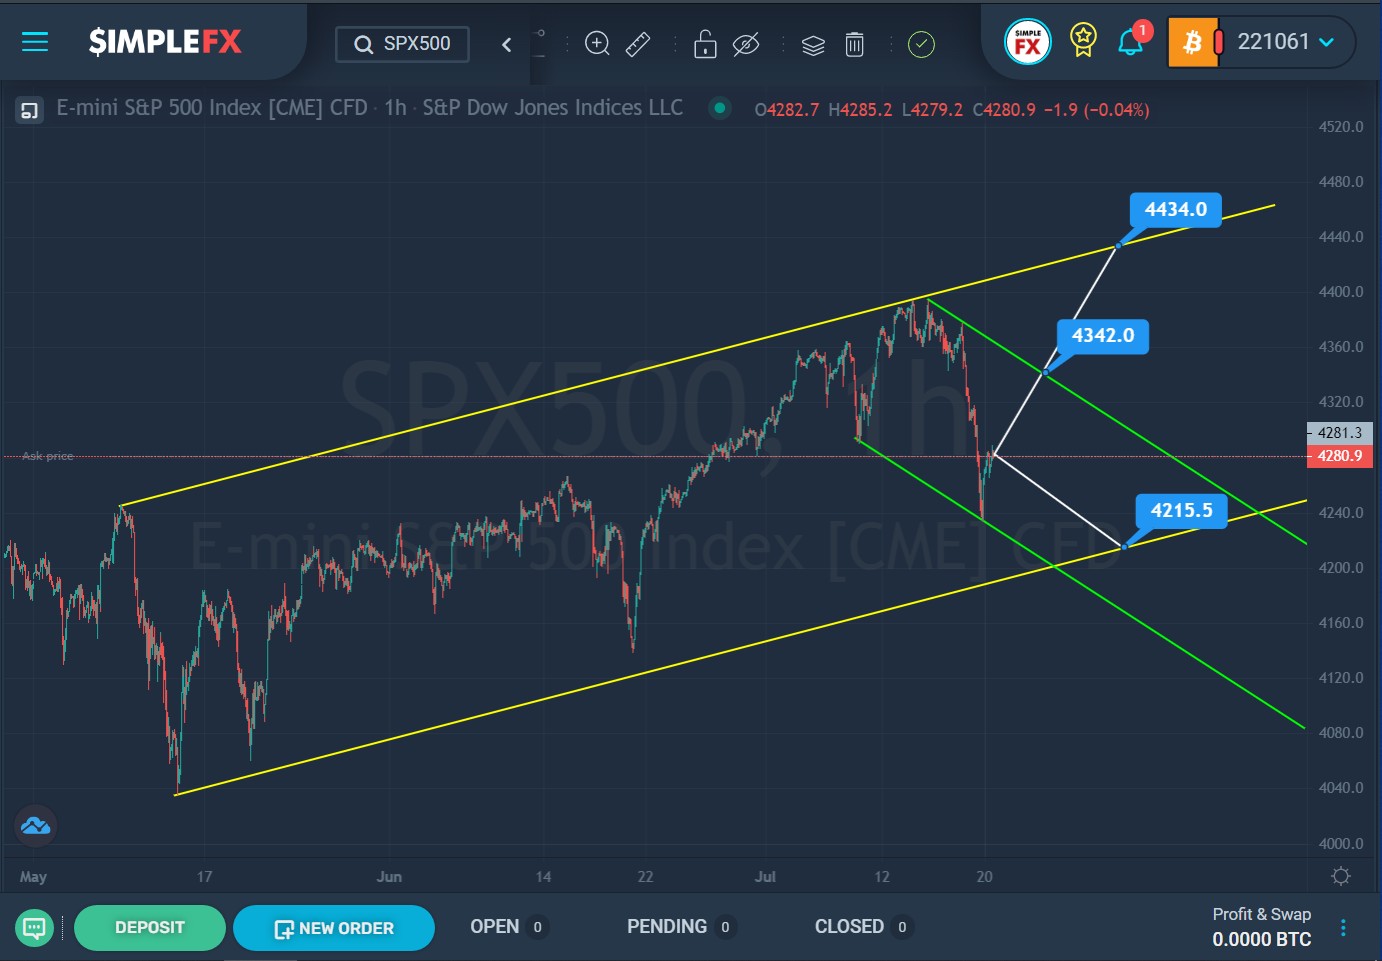
The current structure of the SPX500 index suggests the development of a bullish trend, which is formed within the large yellow channel.
Over the past month, we have observed an increase in the price towards the upper yellow line. Recently, the price reached this limit and then pushed off from it. It is possible that in the near future the price will move down inside a small green channel, as in the last section of the chart you can see a rapid fall to the support line of the green channel. Most likely, the market will continue to move towards the lower yellow wall and the support level of 4215.5.
Alternatively, the market is expected to grow towards the upper green line and the resistance level of 4342.0. If this level is successfully broken, the price can continue to grow towards the next important resistance level of 4434.0, which is on the upper yellow line.
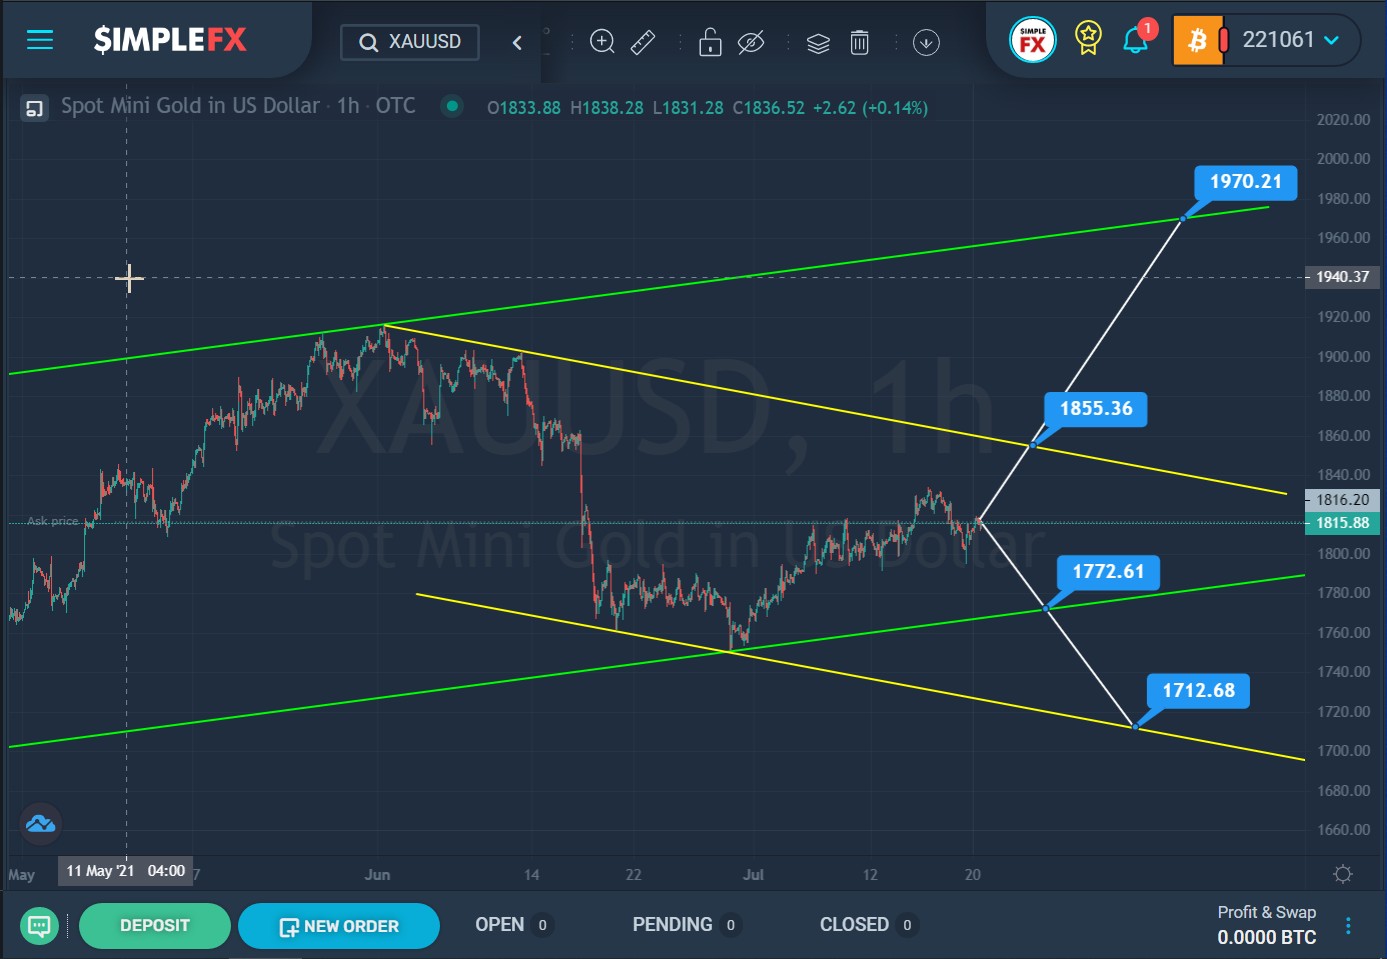
The formation of the XAUUSD pair hints at the development of an upward trend that moves within the green channel.
In the last section of the chart, we see that from June to July, the market moved in a downward direction from the upper wall to the lower wall of the green channel inside a small yellow channel. Then, at the intersection of the two lower lines of these channels, the price pushed off and began to rise smoothly. Most likely, the growth will continue. It is possible that the bulls are targeting the resistance level of 1855.36, which is on the upper yellow wall. If the bulls can break through this level, then they will have a clear path to the upper green line and the resistance level of 1970.21.
Alternatively, the depreciation of gold is expected to continue. The price may fall to the support level of 1772.61, which is on the lower green line. If the bears can break through this level, then the market decline will continue even lower – to the support level of 1712.68, which is on the lower yellow wall.