


The Bank of England has been hinting at an interest rate rise for a while now. But, with the sudden strengthening in sterling and indications that inflation is set to exceed its target levels over coming years, it appears as if they are finally preparing us for what will undoubtedly be another difficult period ahead.
The British Pound is being tipped to remain supported over coming days and weeks amidst signals that the Bank of England might raise rates next year but before then there may be plenty more uncertainty on currency markets yet again when Brexit negotiations restart later this month.
Let’s take a look at GBPUSD today, and in the second part, we analyze the Japanese stock market.

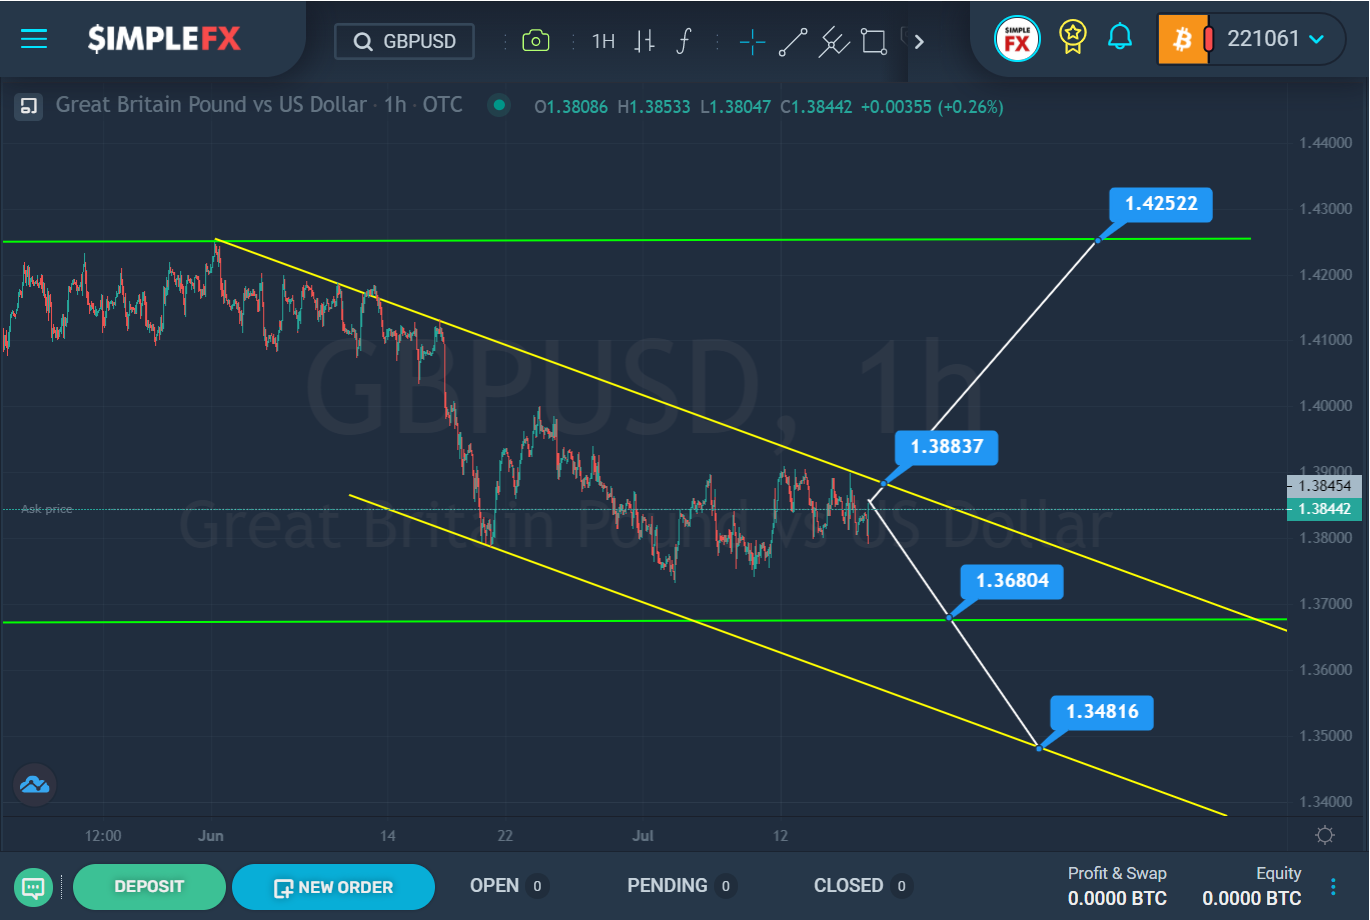
A horizontal trend with an upward slope seems to be forming for the GBPUSD currency pair.
In June, the market reached the upper green line, then pushed off from it and went down within the yellow channel.
Most likely, the bears are aiming at the level of 1.3680, which is on the lower green line. If this level is successfully broken, the bears will open the way to the next important support level of 1.348, located on the lower line of the yellow channel.
However, it is possible that the bulls will be able to take over the market, it is enough to break through the resistance level of 1.388, which is on the upper yellow line. By the way, now the price is close to this level. When the specified price level is broken, market participants can expect an increase in the price in the direction of the resistance level of 1.425, located on the upper green wall.

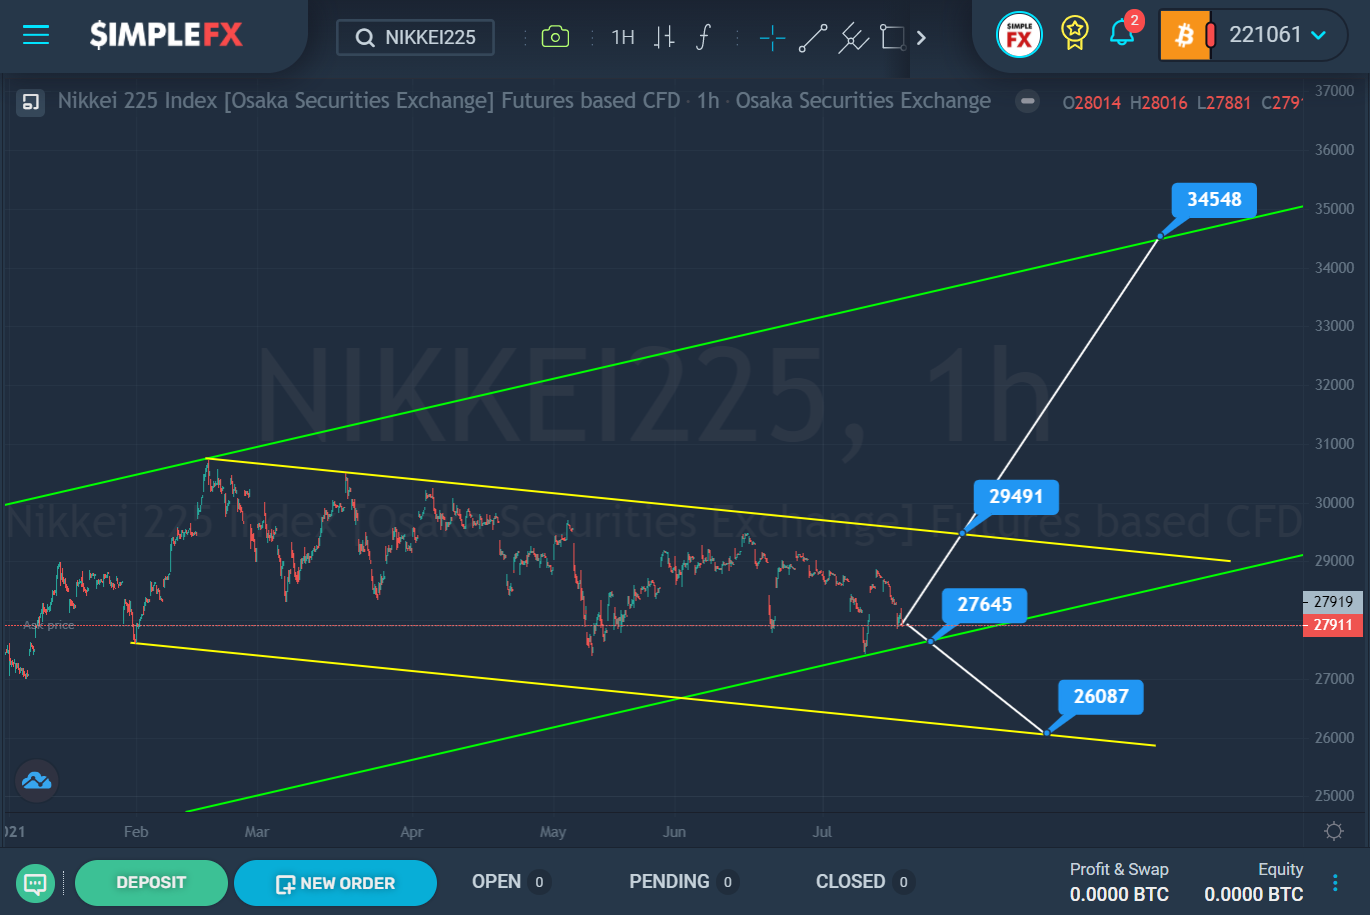
The stock index seems to be forming a bullish trend that moves within the ascending green channel. At the end of February, the price pushed off from the upper green line and began to gradually decline within the descending yellow channel.
Currently, the price is near the lower green line. The bears need quite a bit of effort to reach the support level of 27645. If this level is broken, a path will open for them to the lower yellow line and the support level of 26087.
Alternatively, a bullish market movement is assumed. If the market reaches the resistance level of 29492 and then breaks it, then the bulls will open the way to the far resistance level of 34548, which is on the upper green line.


