
Turkish economy is opening post-lockdown, and the increased activity drove the inflation to 17.53% in June. The currency will be affected by the news and we give you a technical outlook of the Turkish lira.
In the second part of our analysis, we examine what will happen after the recent EURUSD drop. Enjoy!
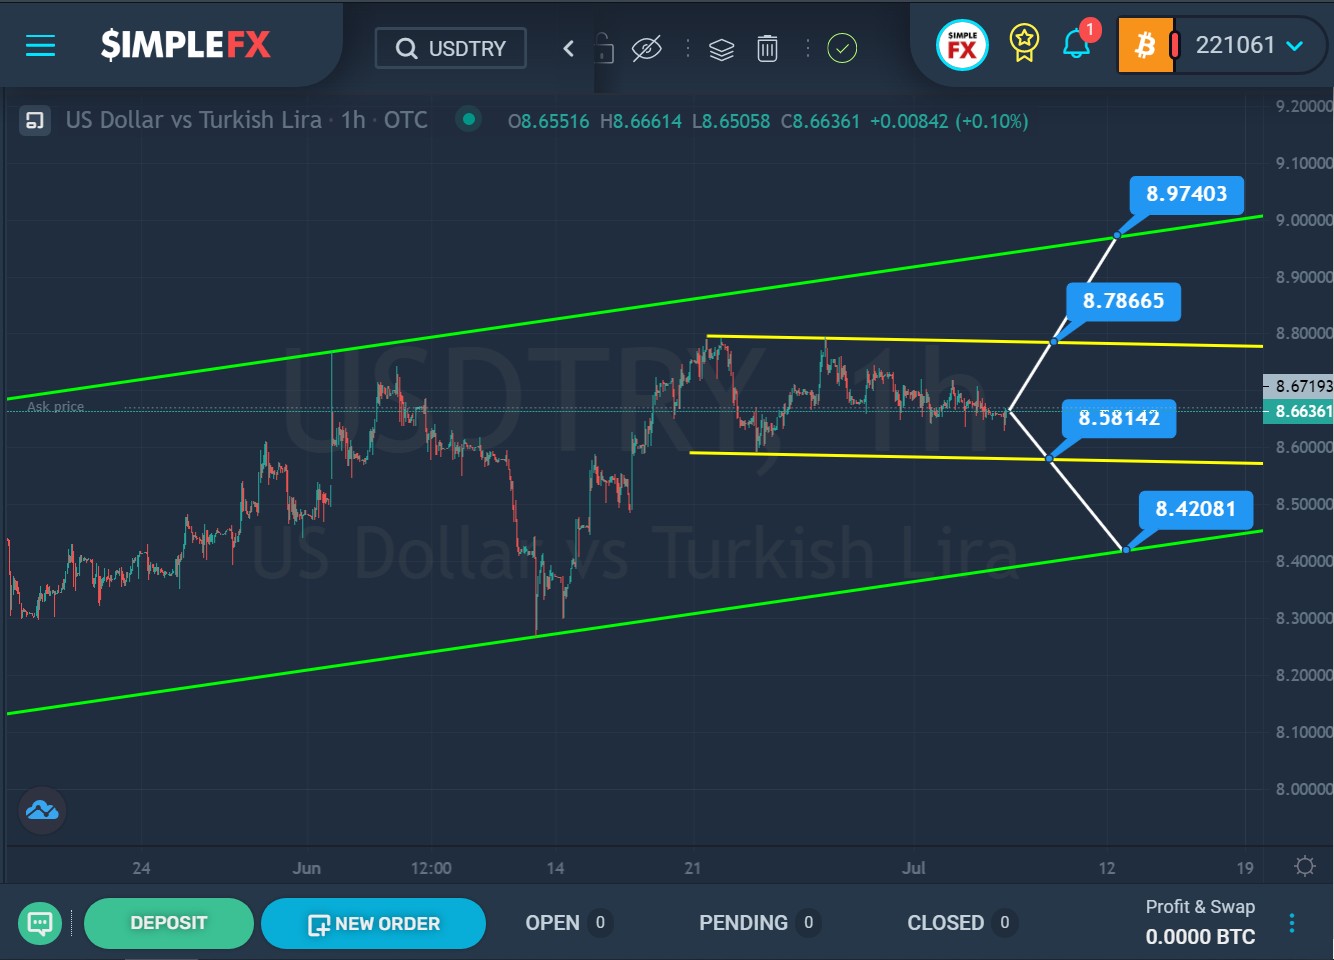
The formation of the USDTRY pair suggests the development of an uptrend that moves inside the bullish green channel.
After the last rebound from the lower green line, the price went up to the upper green wall. However, the bulls did not have enough strength to push the market to this wall, and the price began to gradually decline. This section describes a small descending yellow channel.
It is possible that if the bears break through the lower yellow wall near the support level of 8.58, the price will continue to fall to the lower green line and the support level of 8.42.
Alternatively, an upward move is expected to the upper yellow line and the resistance level of 8.78. If this level is broken, the bulls will have a chance to rise to the resistance level of 8.97, located on the upper green line.
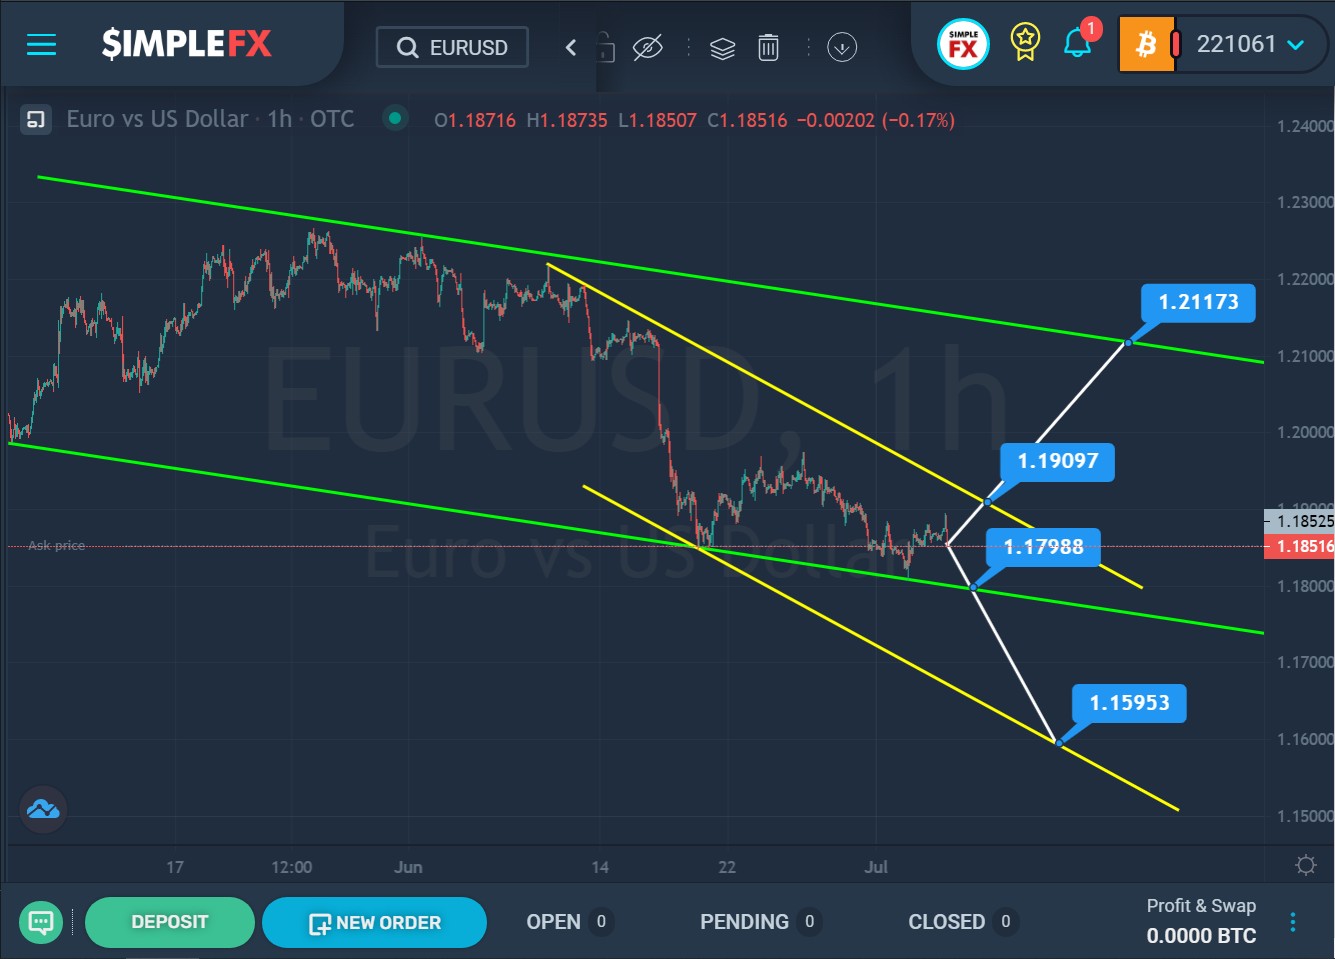
The EURUSD currency pair forms a bearish trend that moves within the green channel.
In the second half of June, the price pushed off from the intersection of the lower walls of two channels: green and yellow. The yellow channel describes the last descending section of the chart. Recently, the market again tried to break through the lower green line, but without success.
It is possible that the bears will repeatedly make an attempt to break through the lower green line. If the support level of 1.179 is reached and broken, the bears will open the way to the lower yellow line and the support level of 1.159, as shown on the chart.
The second scenario considers a situation where the bulls are stronger than the bears. In this case, the price will start to rise in the next coming trading days. When the resistance level of 1.190 is reached, which is on the upper yellow line, and then when this level is broken, the price can rise to the resistance level of 1.211, which is on the upper line of the green channel.