


Bitcoin price has been falling this month. While the bears are expecting a run below the $30k support, bulls argue it’s the last call for buying in low. Let’s analyze it.
In the second part of our post, we’ll take a look at one of the most exciting forex pairs: GBPAUD.

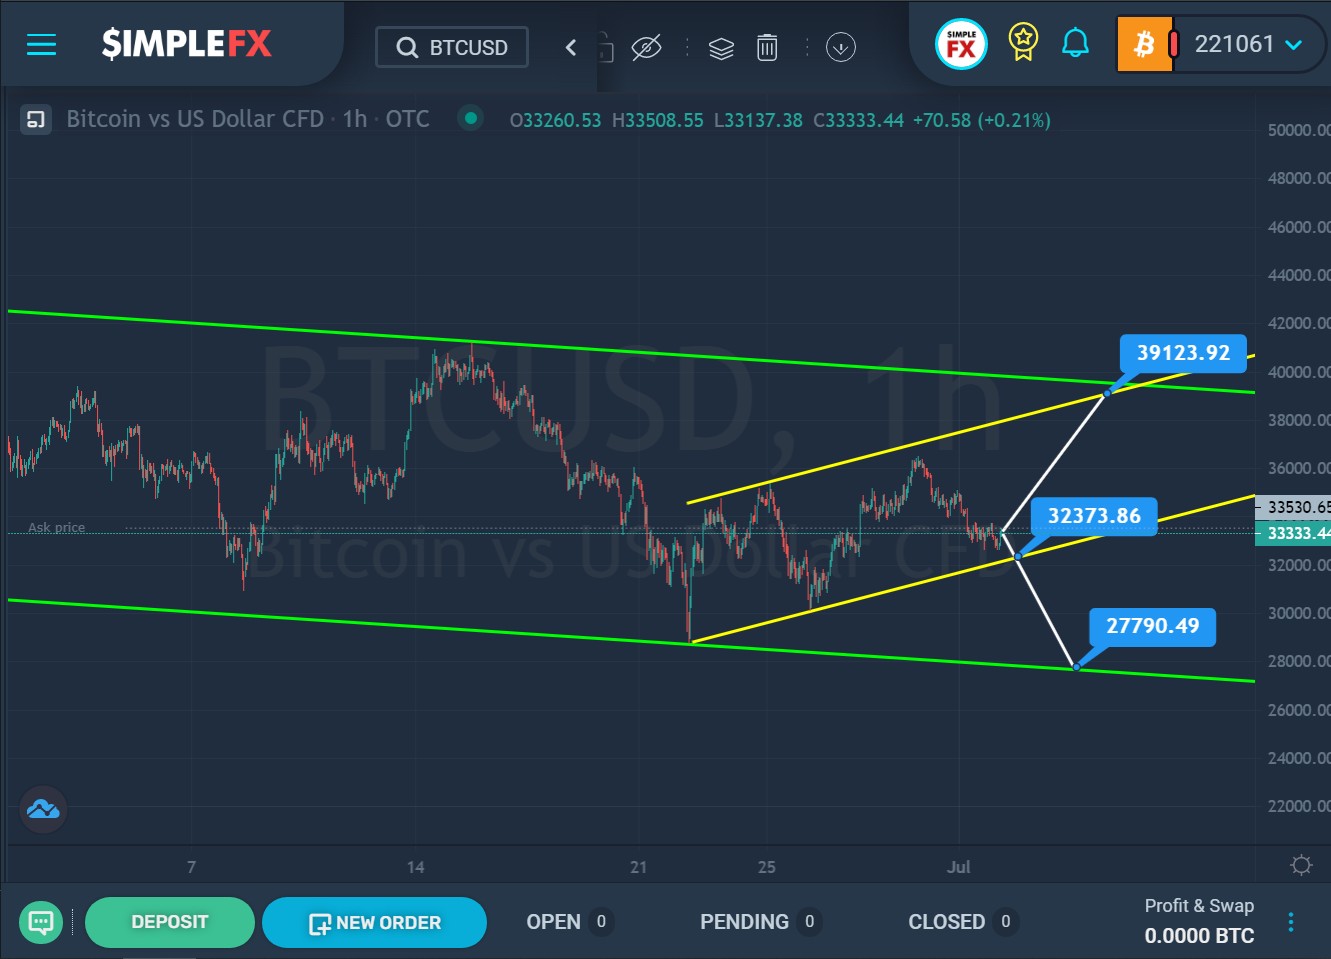
For the BTCUSD cryptocurrency pair, the market is moving in a downward direction within the green channel, forming a bearish trend.
For the last half a month, we have observed the price move from the upper to the lower line of the green channel. Not so long ago, the price touched the lower green line, and then we saw its reversal and the beginning of growth. The last section of the chart describes the ascending yellow channel.
Perhaps the market has already formed a small correction, so in the near future, the price may continue to move down as before. If the bears break through the lower yellow line near the support level of 32373.86, then the decline will continue to the lower green wall and the support level of 27790.49.
There is a second scenario in which it is assumed that the bears do not have enough strength, and they lost to the bulls. In this case, the market will rise up in the direction of the resistance level of 39123.92, which is on the upper yellow wall.
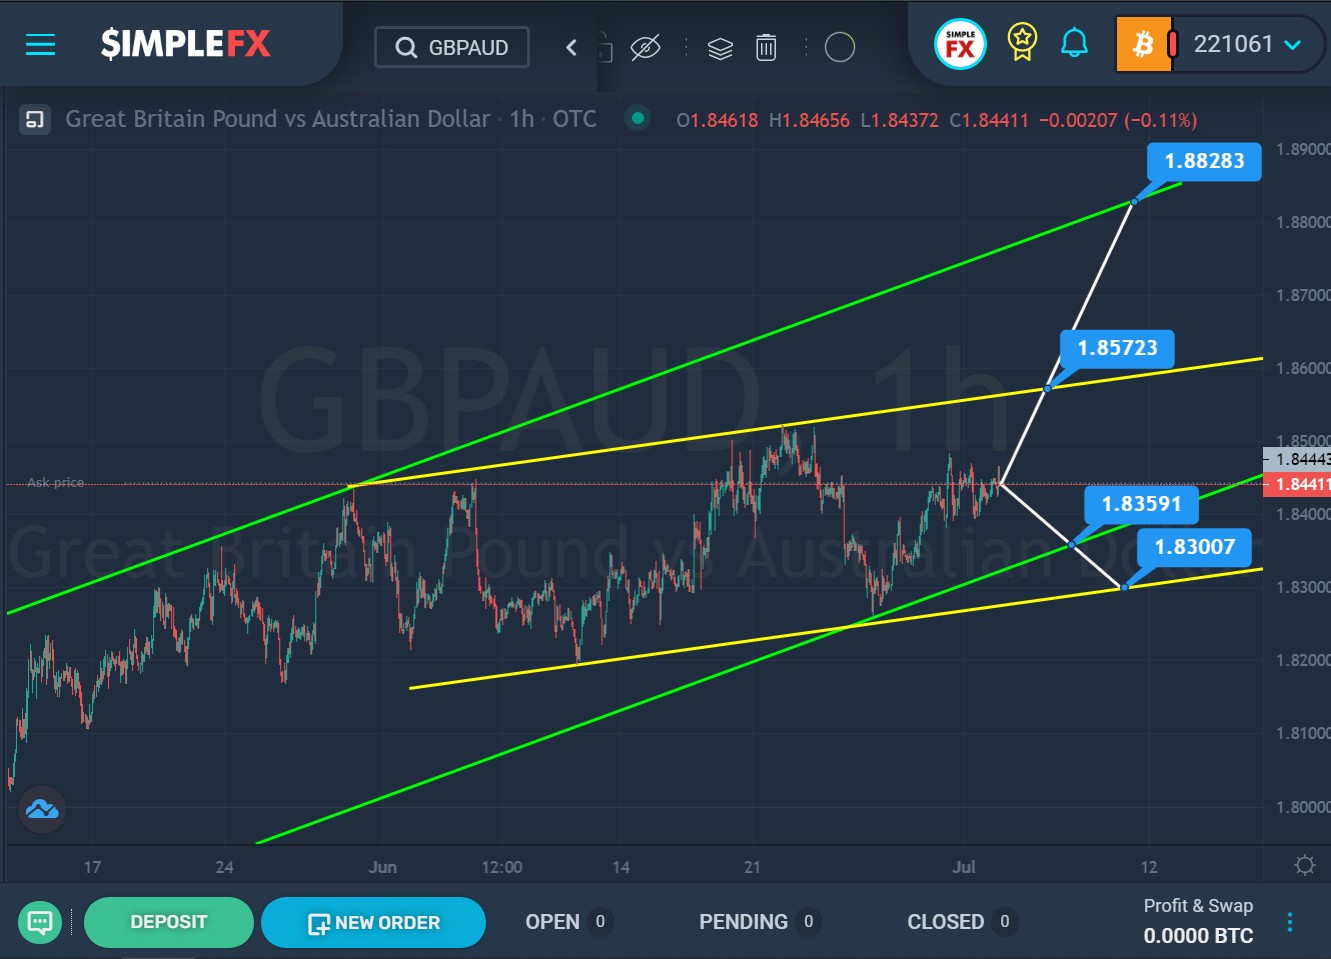
The current structure of the GBPAUD currency pair shows the formation of an upward trend that moves inside the green channel.
Since June, the price has been moving from the upper green wall to the lower green wall inside the smaller yellow channel. After the price touched the lower green line, we saw a market reversal and the beginning of growth.
Perhaps the price increase will continue in the next coming trading days. If the bulls have enough strength to reach the resistance level of 1.857, which is on the upper wall of the yellow channel, and then break through it, then the path to the upper green line and the resistance level of 1.882 will become clear for them.
Alternatively, the market may decline again to the lower green wall. If the support level of 1.835 breaks, which is located on it, the price may fall even lower – to the support level of 1.830, which is on the lower wall of the yellow channel.


