
Dow Jones futures retreated on Monday, as investors showed concern about the next COVID wave. Let’s analyze DJI30 and explore the possibilities.
In the second part of our technical outlook, we ask whether the Japanese yen is able to appreciate against the euro. This would open some intriguing opportunities for forex margin traders.
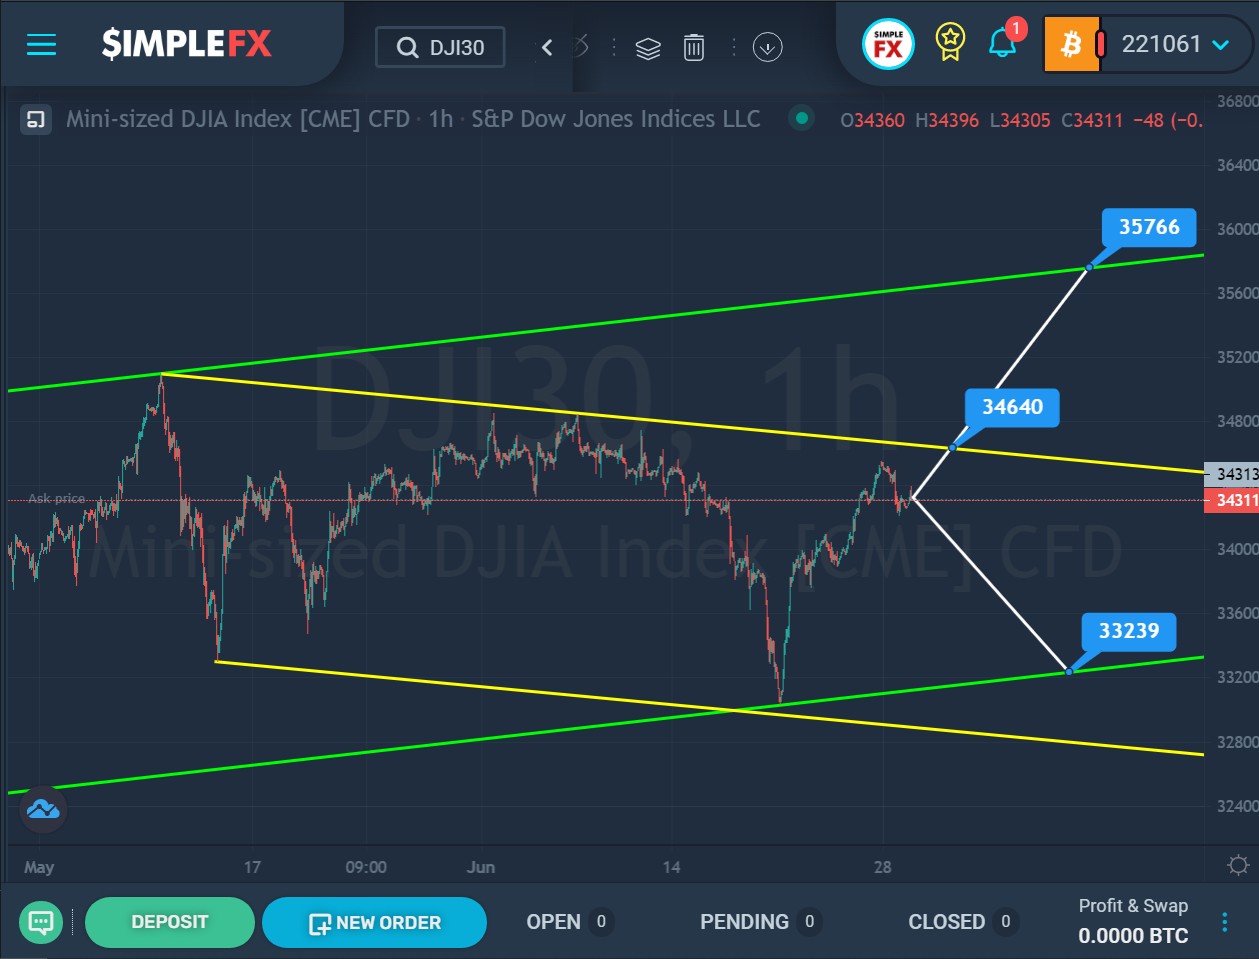
The formation of the DJI30 index shows the development of a bullish trend that moves inside a large green channel.
In the first half of May, we saw how the price pushed off from the upper green wall and began to go down in the direction of the lower green wall within the yellow channel. Not so long ago, the market touched the lower green line, but did not break through it, but began to rise sharply upwards.
It is possible that the price increase will continue. In the event of a break of the level of 34640, which is on the upper yellow wall, the bulls will be able to move further, since there will be no obstacles for them. Their next target is the resistance level of 35766, located on the upper green wall.
Alternatively, the market is expected to move down towards the lower green line and the support level of 33239.
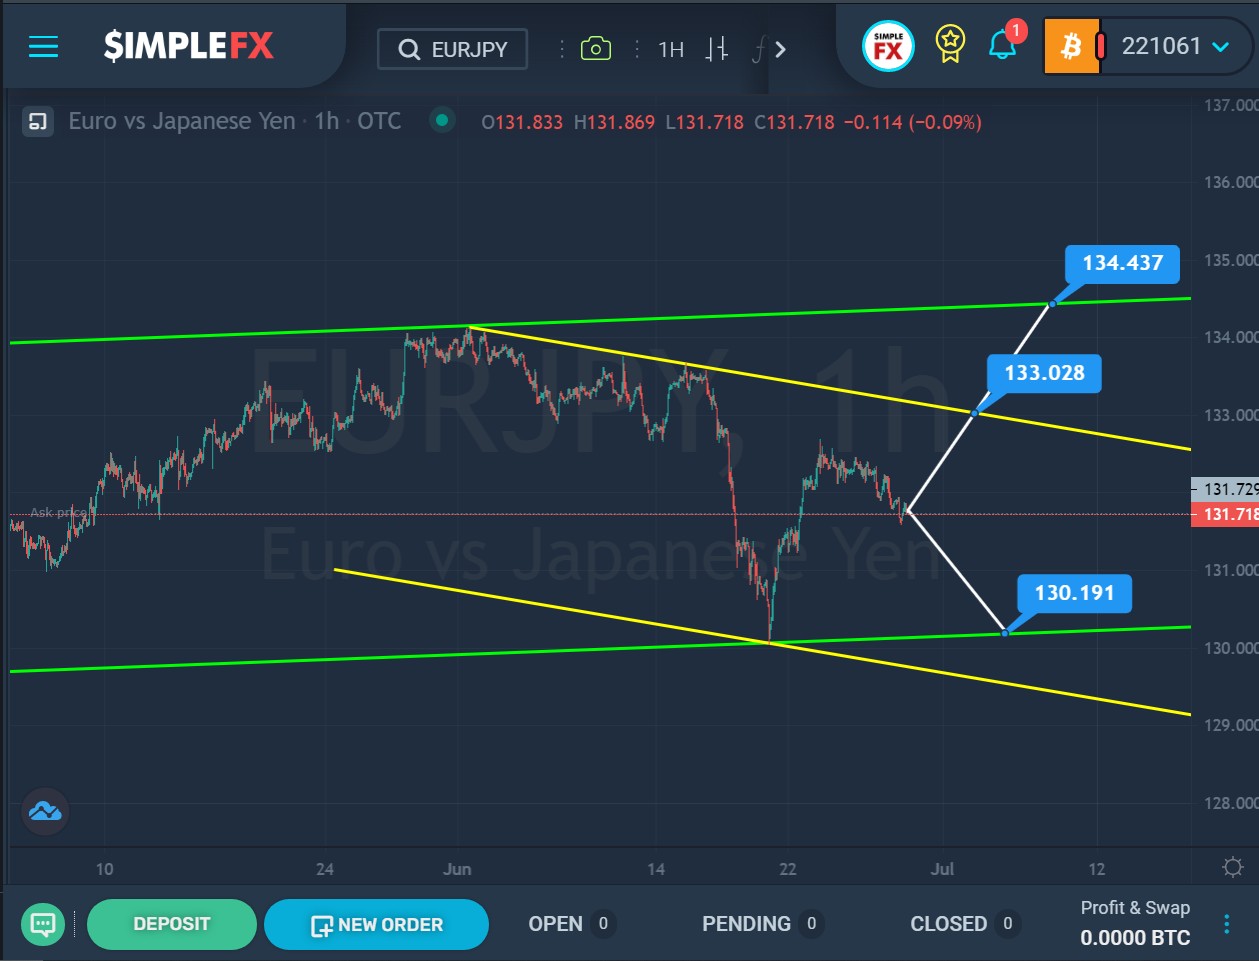
The formation of a currency pair suggests the development of an uptrend that moves inside a large green channel.
The last section of the chart, where we see the downward movement of the price from the upper green line to the lower green line, describes a yellow bearish channel.
Not so long ago, the price touched the lower wall at the intersection of the lower lines of the two channels, and then the rise began. Perhaps the bulls will continue to push the price up. When the resistance level of 133.02 is reached, which is on the upper yellow line, and then its break, the bulls will continue to move to a higher resistance level of 134.43, located on the upper green wall.
Alternatively, market participants could expect the pair to decline to the lower green line and the support level of 130.19.