


Swiss franc hit a local minimum recently and the USDCHF pair has entered a formation that may go anyway in the next hours. We’d also recommend following EURGBP closely.

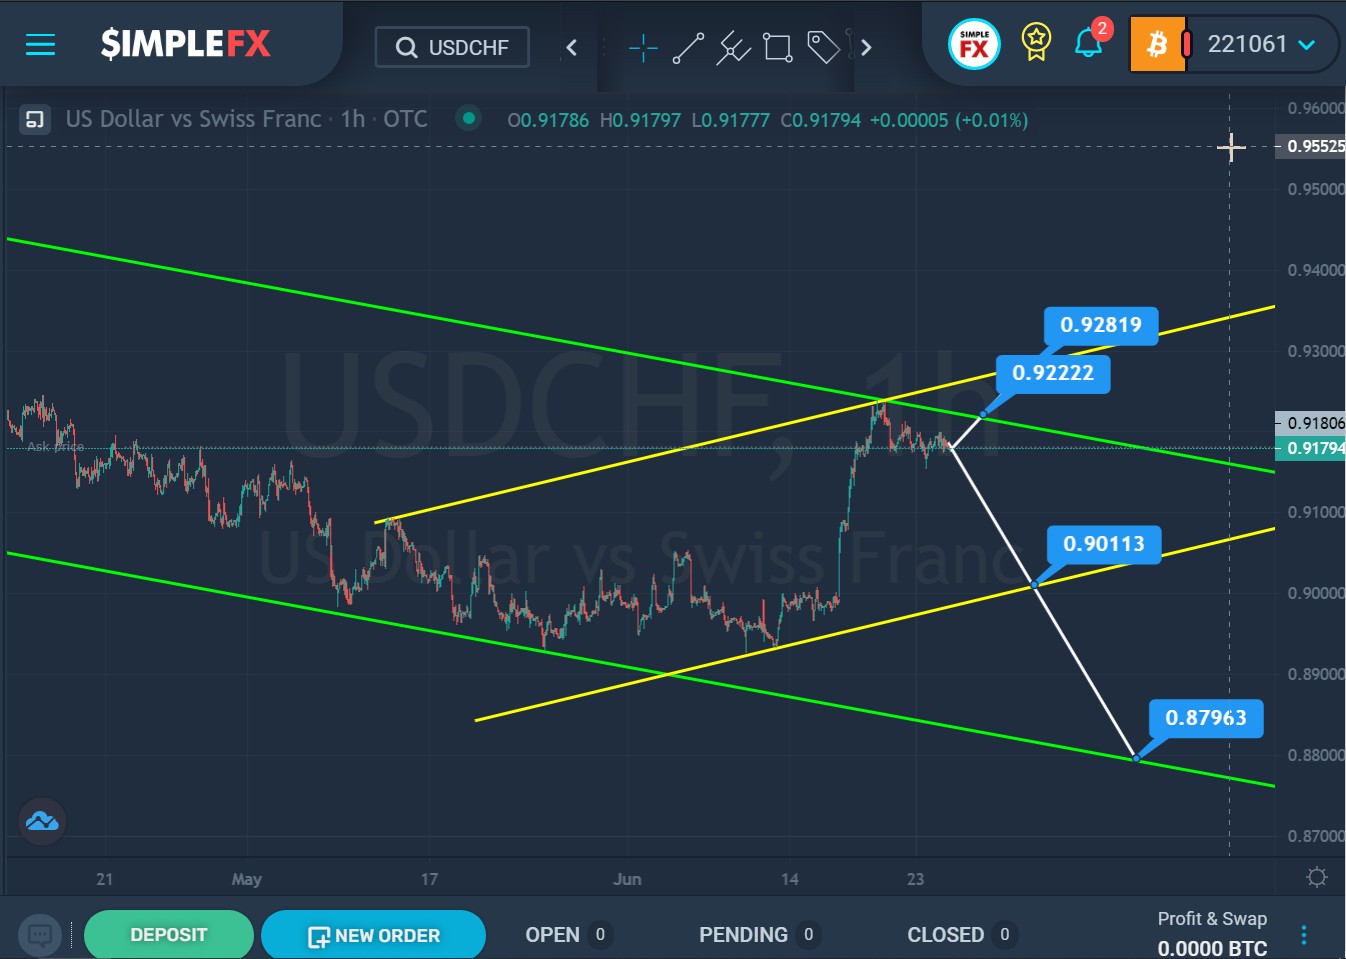
The formation of the USDCHF currency pair suggests a downtrend that moves inside a large green channel.
In the second half of May, the price touched the lower green line and then pushed off from it and began to move up within the yellow channel.
In the last section of the chart, we see a sharp jump in the price from the lower yellow wall to the upper walls of the two channels, at the point of their intersection.
Perhaps the market will continue to move up. If the resistance level of 0.922 is broken, which is on the upper green line, the price can rise to the resistance level of 0.928, which is on the upper yellow wall.
Alternatively, market participants expect the price to fall in the direction of the support level of 0.901, which is on the lower yellow line. If the bears can break through this level, then they will open the way to the next important level of 0.879, which is on the lower green line.

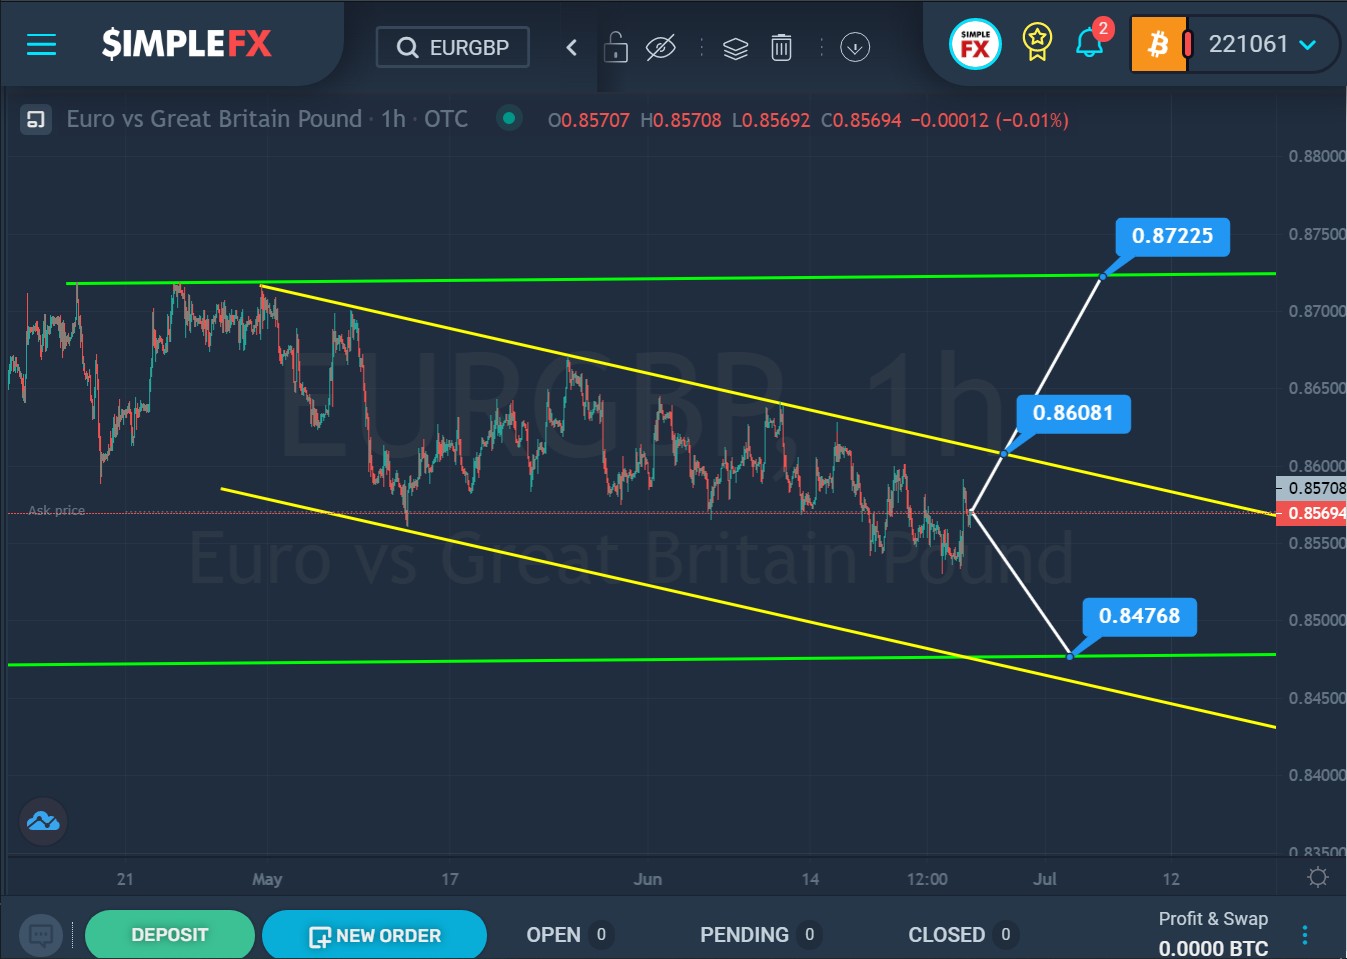
For the EURGBP currency pair, we see the market move within the ascending green channel. The last section of the chart, where the price pushed off from the upper green line and began to move down, describes a descending yellow channel.
Currently, we see that the market is already close to the lower green line. Perhaps, in the next coming trading days, the price will continue to fall to the support level of 0.847, which is on the lower green line.
However, it is possible that the bulls will pull the market with them. With a successful break of the resistance level of 0.860, which is on the upper yellow wall, this scenario may be confirmed. In this case, the bulls will open the way to the upper green wall and the resistance level of 0.872.


