

Tired of the falling cryptocurrency markets? Let’s take a look at assets that are currently trending up. The USD is growing against the Canadian dollar. The pair is forming an intriguing formation on a 1-hour chart.
Nasdaq has recovered from the mid-May drops and posted an all-time high recently. The channels are pointing slightly up, which may be a good moment to enter the market. Tech stocks offer substantial opportunities right now.
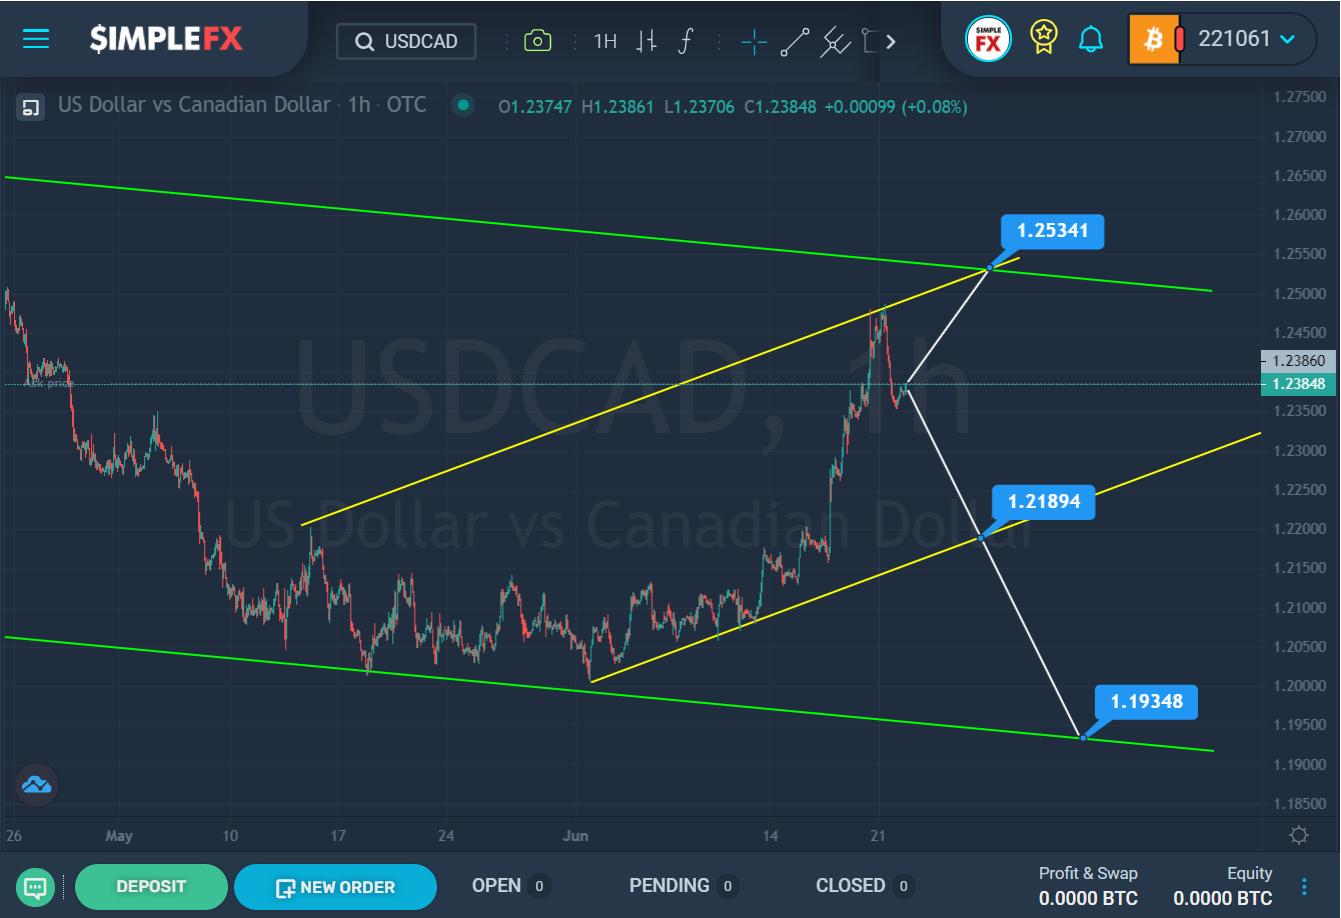
The USDCAD currency pair shows the construction of a global downtrend that moves inside the green channel.
In the second half of May, the price touched the lower green wall of the green channel, then pushed off from it and began to move in an upward direction within the bullish yellow channel. For a while, the market moved in the lower part of the yellow channel, but then we saw a sharp jump to the upper yellow wall. It is possible that the price growth will continue and the bulls will again reach the upper yellow line near the resistance level of 1.253. At that level, we see the intersection of the upper lines of the two channels.
In the alternative, the strength of the bears prevails. That is, the market may decline to the lower yellow line and reach the support level of 1.218. If this level is successfully broken, the pair may continue to move down to the next important support level of 1.193, which is on the lower green wall.
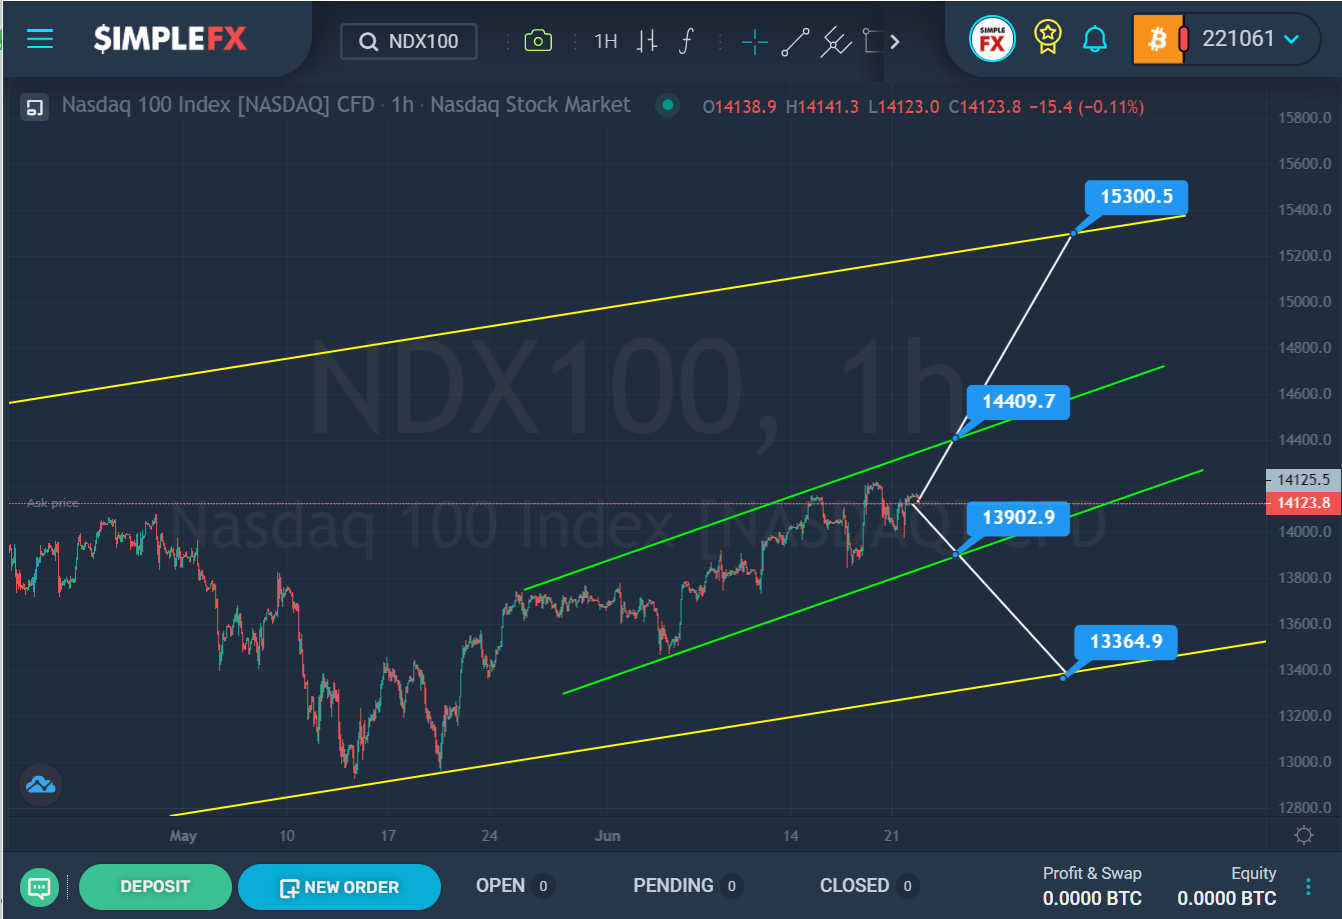
The NDX100 stock index hints at the formation of a major uptrend that moves inside the yellow channel.
In the second half of May, the price went down to the lower yellow wall and then pushed off from it. After that, the market began to slowly rise in the direction of the upper yellow wall. This section describes a smaller green channel.
It is assumed that the market growth will continue in the near future. If the bulls can break through the upper green wall near the resistance level of 14409.7, then they will open the way to the next level of 15300.5, which is on the upper line of the yellow channel.
However, there is a possibility that the bears will overpower the bulls, and then we can expect a depreciation of the index. If the support level is broken, which is on the lower green line, the decline may continue to the lower support level of 13364.9, which is on the lower yellow wall.