


USOIL had a quiet Monday after setting a two-year record. The demand is growing, but the US has increased production, and the UK is struggling with reopening the economy after being hit by a new wave of COVID-19.
In the second part of our analysis, we’ll give you our outlook at USDJPY, which has quietly become the most intriguing major forex pair.

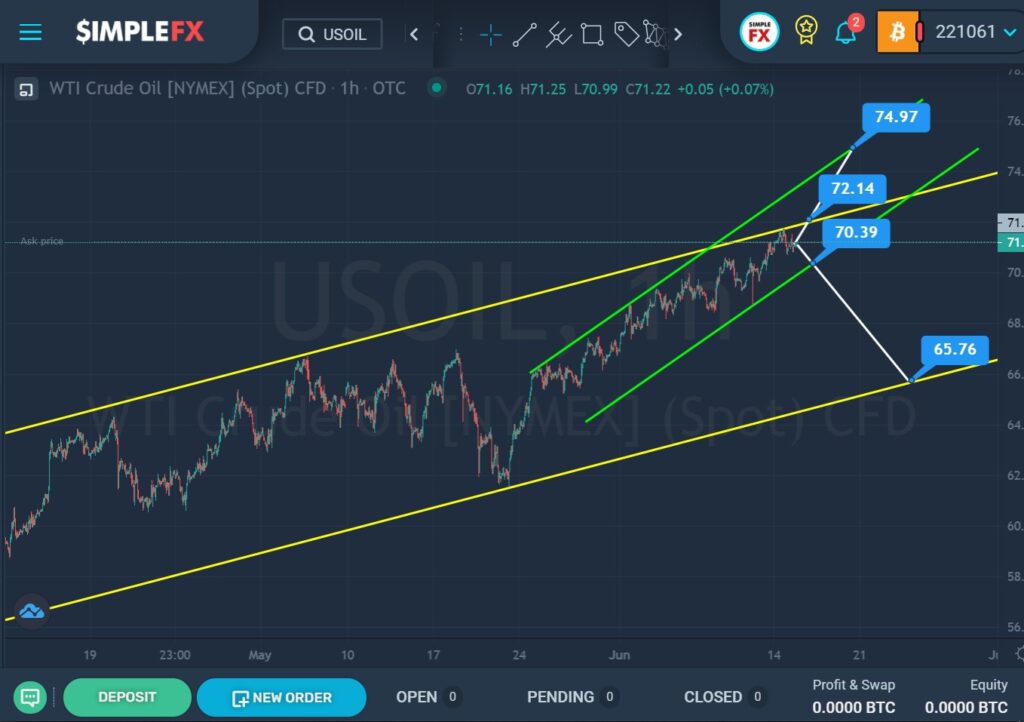
The current structure of oil shows the development of an uptrend that moves inside a large yellow channel.
We can see that in the last days of May, the market touched the lower yellow wall, but then pushed off from it and began to move in an upward direction within a small green channel.
Recently, the price reached the upper yellow line. There is a possibility that the bulls will be able to break through the resistance level of 72.14, which is on the yellow line. If this level is broken, the price is expected to continue rising to the upper green line and the resistance level of 74.97.
However, there is a possibility that after the bulls failed to break through the upper yellow wall, the bears took the lead. This means that in the short term, the oil may devalue.
If the lower green border is broken in the area of the support level of 70.39, we could see the price fall to the support level of 65.76, which is on the lower wall of the yellow channel.
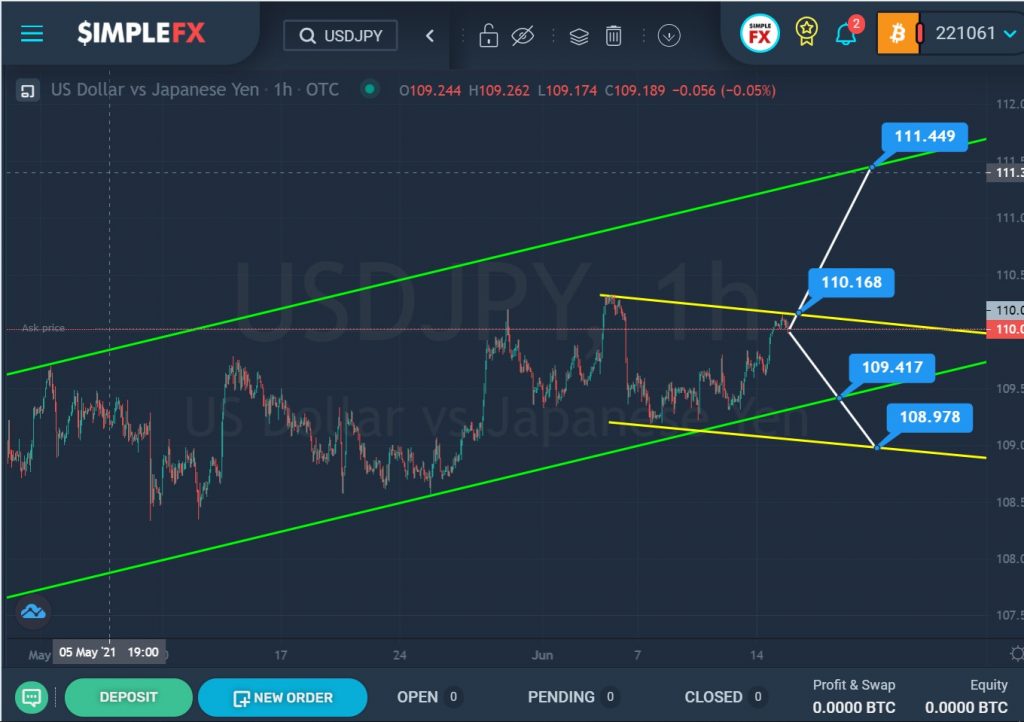
The currency pair continues to develop an uptrend, which moves within the green channel.
After the last rebound from the lower green wall, the price rose to the center of the green channel, and then again went down. The last section of the chart describes a small yellow descending channel.
Currently, we see that the market is close to the upper yellow wall. In the event of a break of this wall near the resistance level of 110.16, the way to the upper green line and the resistance level of 111.44 will open for the bulls.
If the level of 110.16 is not broken, then the price may continue to fall in the direction of the support level of 109.41, which is on the lower line of the green channel. If the bears break through this level, then they can go even lower – to the support level of 108.97, located on the lower wall of the yellow channel.
It is preferable to add this pair to our watchlist!


