


Inflation is going up in the biggest economies. Gold competes with cryptocurrencies as a hedge against the rising price index. Higher inflation also means more incentive to invest in stocks. In our technical gold and S&P 500 outlook, we analyze the possible scenarios for both assets.

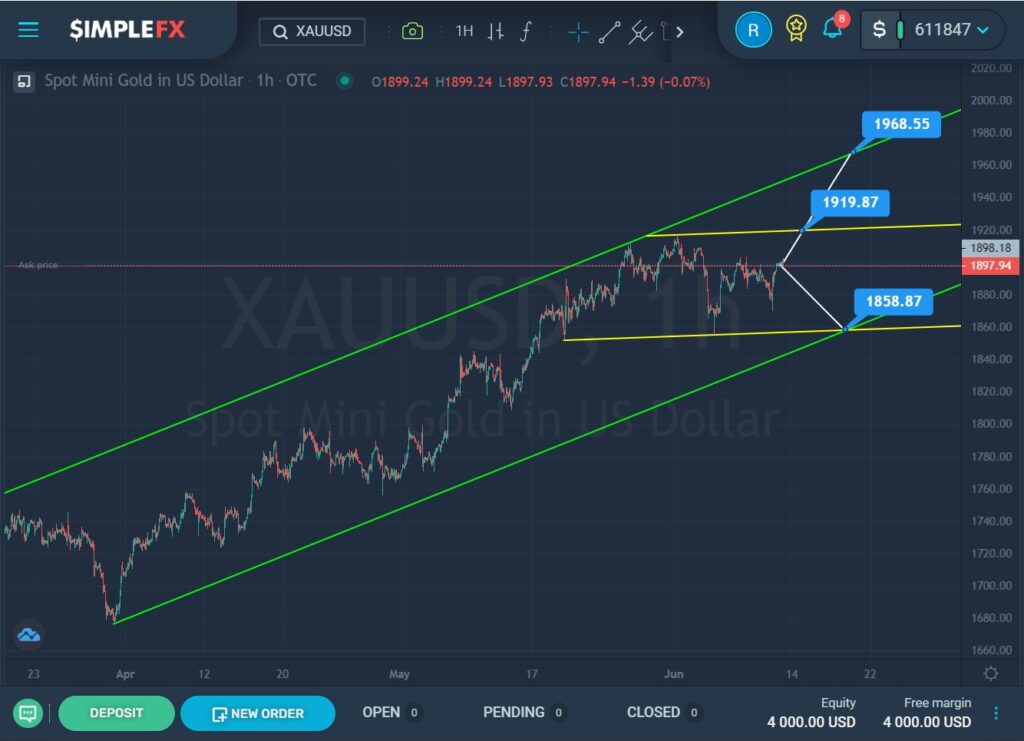
Apparently, a large uptrend is currently under development for gold, which is moving inside the green channel. For two months, the price moved from the lower line to the upper line of the green channel, but the bulls were unable to break through the upper green line.
After rebounding from the upper green wall, the market began to move in a horizontal direction inside a small yellow channel.
Perhaps a small correction has been formed, so the price growth may continue in the near future. If the bulls have enough strength to break through the resistance level of 1919.87, which is on the upper yellow line, then the price can rise to the next resistance level of 1968.55, which is on the upper line of the green channel.
It is possible that in the next coming trading days, the price will go down and possibly reach the support level of 1858.87, which is at the intersection of the lower lines of the yellow and green channels.
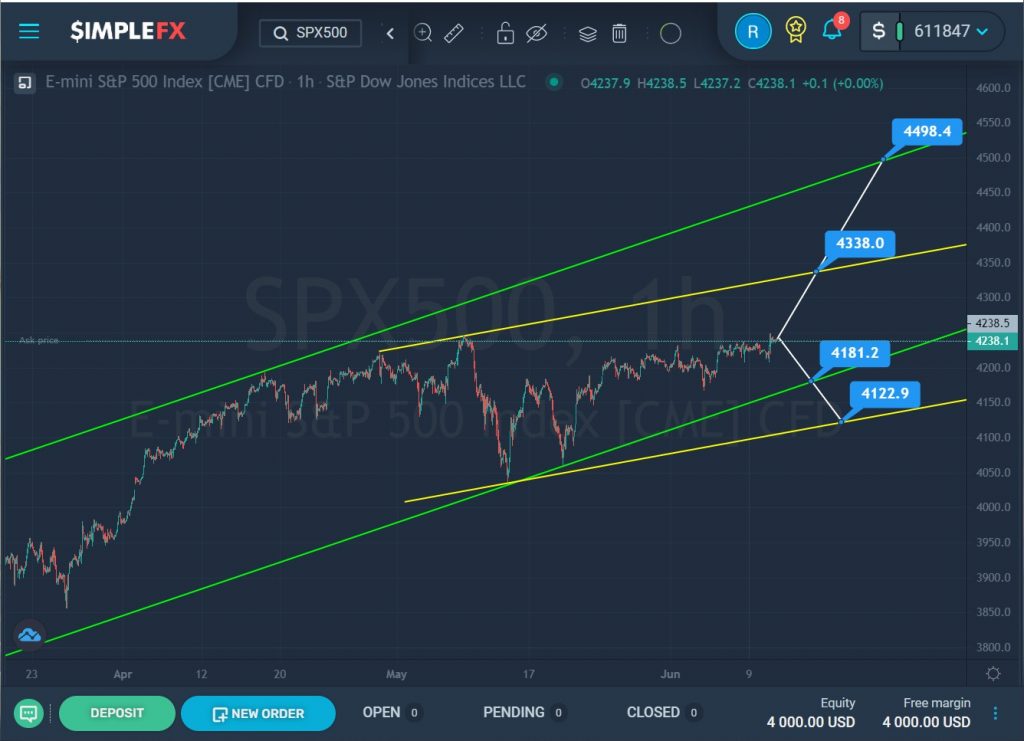
On the SPX500 stock index, a bullish trend is currently under construction, which moves inside a large green channel.
In the last section of the chart, we can see that the bears tried to break through the lower green line several times in mid-May, but they failed. For the last half a month, the price has been slowly moving near the lower green line and in the center of the second yellow channel.
We can expect that the bears will repeat their attempt to break through the lower green line in the current situation. Then, if the support level of 4181.2 breaks, they will be able to go down a little lower – to the support level of 4122.9, which is on the lower line of the yellow channel.
Alternatively, it is assumed that the bulls have had enough time to accumulate strength, and perhaps in the near future, they will take the initiative and lead the market up. Upon reaching the resistance level of 4338.0, which is on the upper yellow line, and then breaking it, the bulls can continue to push the price to the next resistance level of 4498.4, which is on the upper green line.


