
In this post, we’ll examine the current trend at the Japanese stock market as well as LTCUSD. Litecoin used to be one of the top cryptocurrencies but fell out of the top 10. If you believe in the bitcoin alternative, you have to read our analysis.
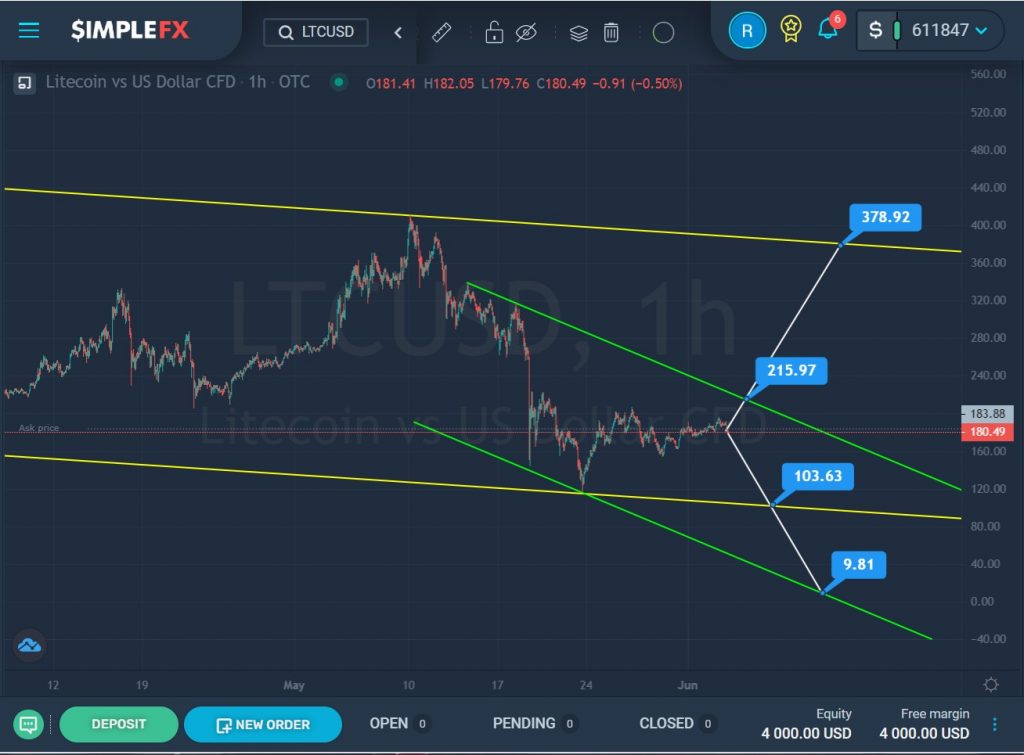
For the LTCUSD cryptocurrency pair, a downtrend is apparently being built, which moves inside a large yellow channel.
For the last half a month, we have seen the price drop from the upper yellow line to the lower line of the yellow channel. On May 24, the market touched the lower yellow wall, but then pushed off from it and headed up. The last section of the chart describes a small green channel.
We see that the price is directed upwards, perhaps soon the market will reach the resistance level of 215.97. If this price level is successfully broken, the way to the upper yellow wall and the resistance level of 378.92 will open for the bulls.
Alternatively, it is assumed that the price will again begin to decline to the lower yellow line and the support level of 103.63. If this level is broken, the market may go even lower to the support level of 9.81, which is on the lower green line.
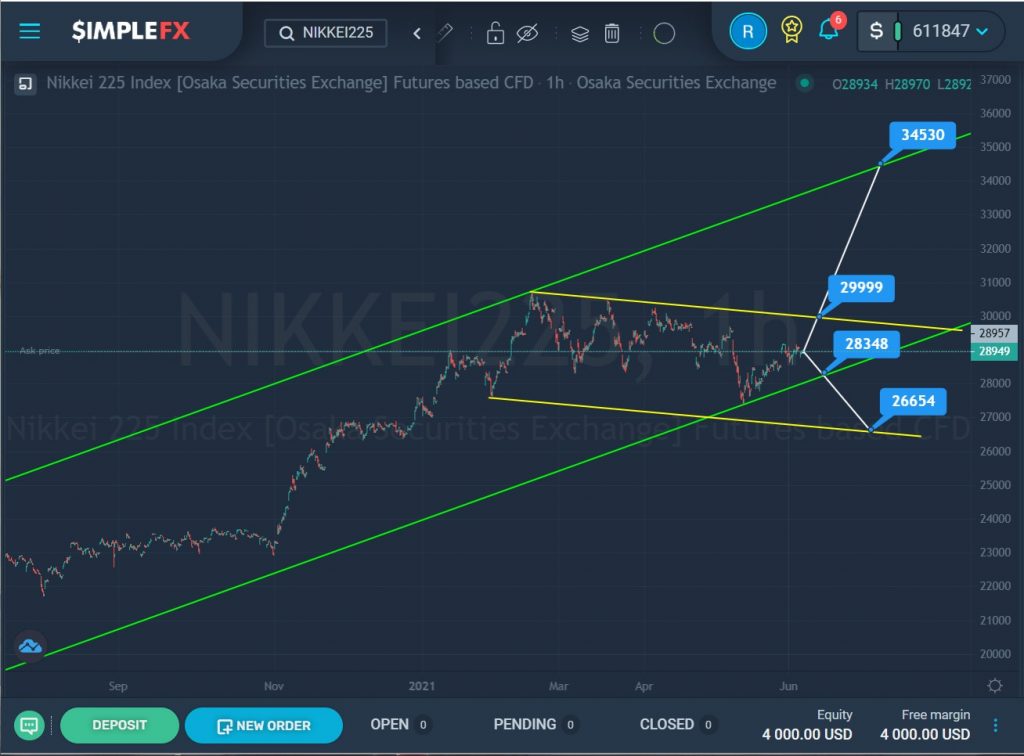
Let’s look at the situation on the NIKKEI225 stock index. It is assumed that a rapid uptrend is forming in the market, which moves within the green channel.
We can see that approximately at the end of February, the price reached the upper green line, however, it did not break through it, but began to go down. Most likely, now there is a development of a corrective figure, which is formed within the yellow channel.
There is an assumption that the correction has come to an end, so the market may rise ahead. If the level of 29999 is broken, which is on the upper yellow line, the bulls will be able to continue moving up to the upper green wall and the resistance level of 34530.
But there is a possibility that the correction will continue, then the price may decline to the level of 28348, which is on the support line of the green channel. Also, if this price level is broken, market participants may see a decline to the next support level of 26654, located on the lower yellow line.