Both BTC and ETH bounced back after two weeks of losses. Is it the time to buy or the moment to short. Read our technical analysis.
In the second part of this post, we’ll also discuss the recent bulls market on silver. Enjoy!

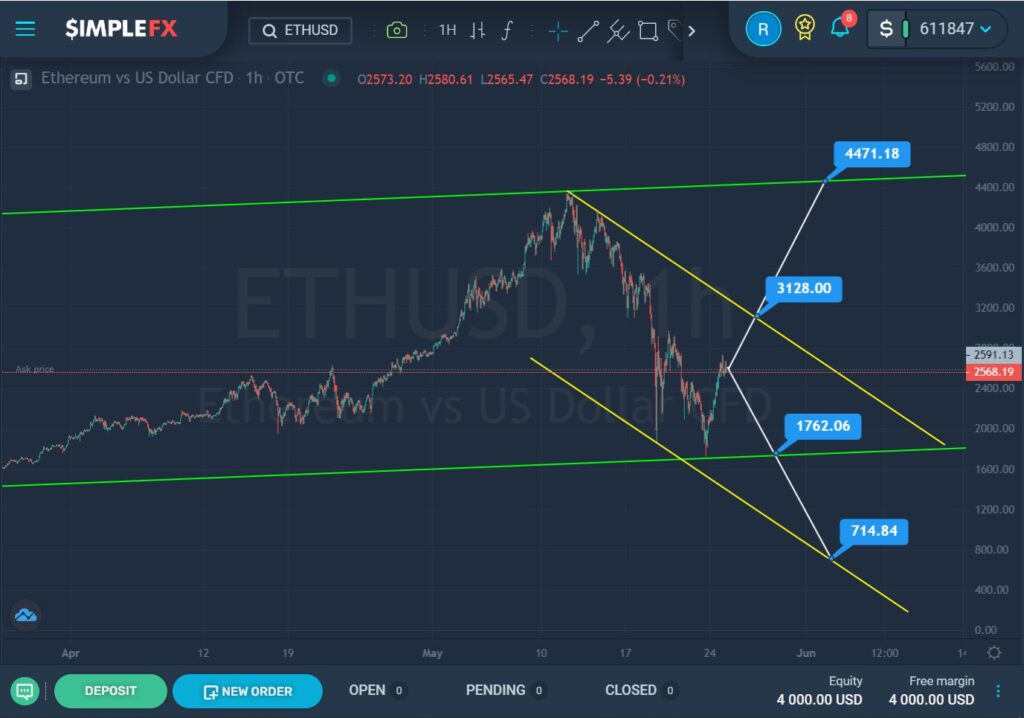
For the ETHUSD cryptocurrency pair, we see the formation of an uptrend that moves within a large green channel.
More than a week ago, the price touched the upper green line, until then the market was slowly rising up. After the rebound, we saw a sharp drop to the lower green wall. This section describes a yellow descending channel.
Since the bears did not break through the lower green line, we can assume that they do not have enough potential to lead the market further. In this case, we can expect an increase in the price. With a successful break of the upper yellow line near the resistance level of 3128.00, we can see a continuation of growth in the direction of the upper green line and the resistance level of 4471.18.
However, we do not exclude the possibility that the bears may try again to break through the lower green line near the level of 1762.06. With a successful break, the price will go even lower to the lower yellow line and the support level of 714.84.

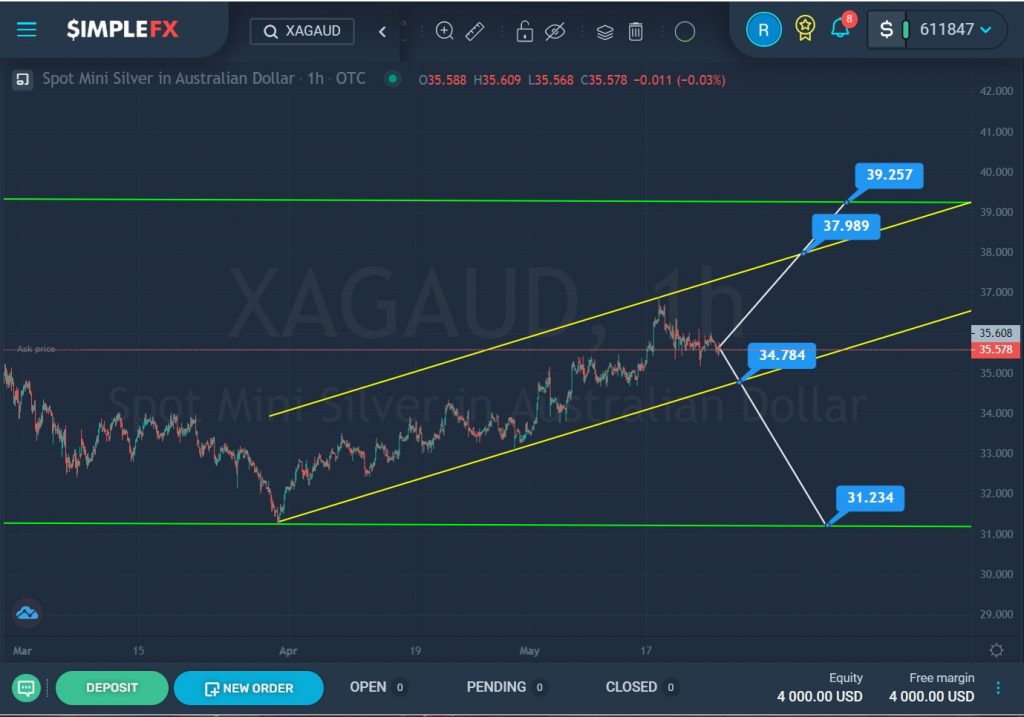
The XAGUSD formation hints at the formation of a horizontal trend with a downward slope inside a large green channel.
At the beginning of April 2021, the price touched the lower green line and pushed off from it. Then the market gradually increased inside a small ascending yellow channel.
It is assumed that the bulls will continue to push the price up. If the resistance level of 37.98 is successfully broken, there will be no obstacles for them to continue moving towards the resistance level of 39.25, which is on the upper green line.
Alternatively, the market may decline. If the bears break through the support level of 34.78, which is located on the lower yellow wall, then they will open the way to the lower green line and the support level of 31.23.
