
BTCUSD technical analysis shows a moderate outlook for the next days. It seems for the time being cryptocurrency markets are all in on Ethereum, and similar altcoins supporting DeFi products.
In the second part of Tuesday’s analysis, we take a look at the growing price of the dollar against the Turkish lira. USDTRY is going to be one of the most exciting forex pairs this week.
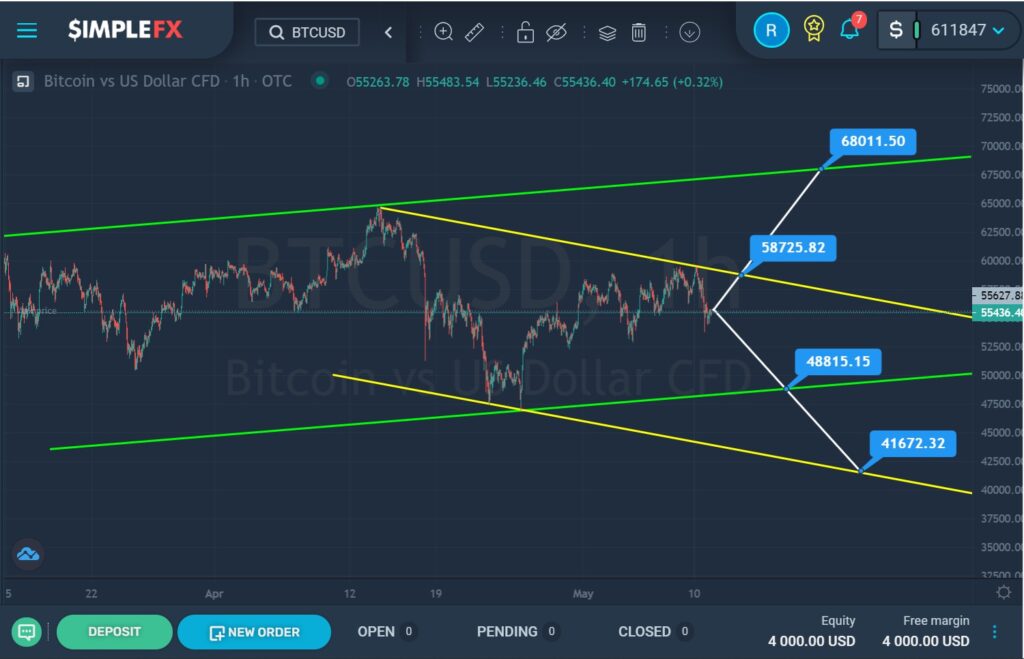
Apparently, a bullish trend is forming for the BTCUSD cryptocurrency pair, which is moving inside the green channel.
In mid-April, the price touched the upper green line, then pushed off from it and went down within the descending yellow channel. In the short term, the price reached the lower green wall but did not break through it, and again went up.
Currently, the market is in the center of the green channel and in the upper yellow zone, so there is a chance that the bulls will break through the upper yellow line near the resistance level of 58725.82. If this happens, then we can see a continuation of growth in the direction of the resistance level of 68011.50, which is on the upper green line.
In the second option, it is assumed that the bulls gave way to the bears and now the price is going down. It is possible that the market is moving towards the support level of 48815.15, which is on the lower green line. In the event of a break of that level, the bears will continue to decline to the lower support level of 41672.32, as shown in the chart.
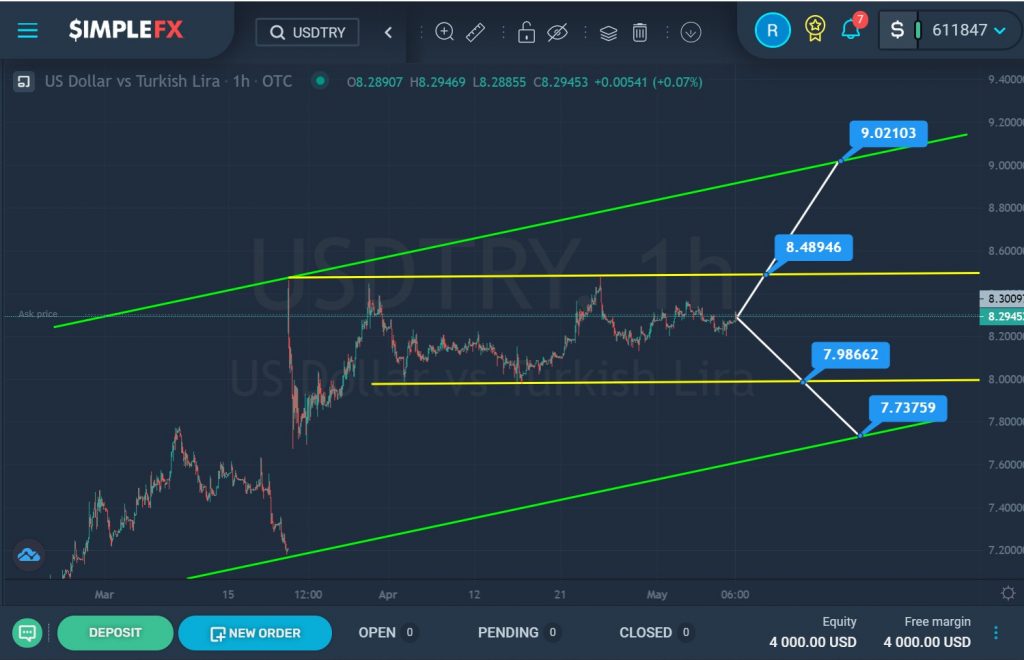
The USDTRY currency pair seems to be forming a bullish trend, which moves within a large green channel.
After a sharp jump in the price from the lower line to the upper line of the green channel, the market began to move in a downward direction inside the small yellow channel. Perhaps the price will continue to fall and soon touch the lower yellow line. If the support level of 7.98 breaks, the decline may continue to the next support level of 7.73, which is on the lower green line.
Alternatively, market participants may expect an increase in the currency pair. If the bulls can reach the resistance level of 8.48, which is on the upper yellow line, and then break it, then prices can rise to the next resistance level of 9.02, which is on the upper line of the green channel.