
DJI30 hit an all-time high closing for the 23rd time in 2021 yesterday. How long will the stocks go up? Take a look at our technical analysis before trading US equities today.
We also pick apart GBPAUD and wonder if there’s a trend reversal possible on this pair.
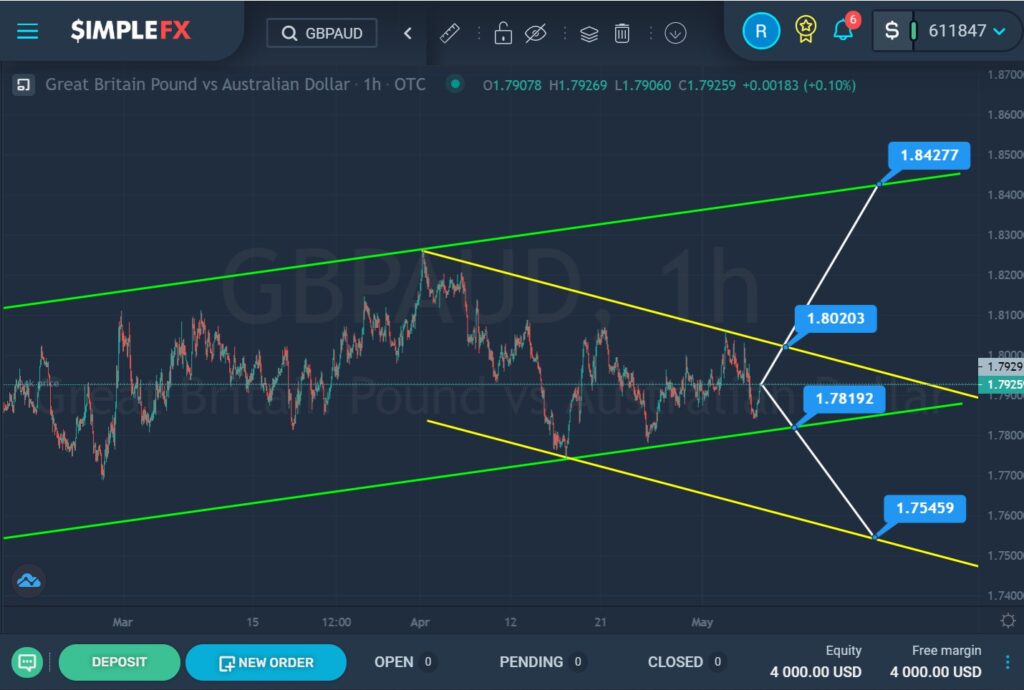
Let’s look at the situation for the GBPAUD currency pair.
Its current structure shows the development of a bullish trend that moves inside the green channel. In early April, the price pushed off from the upper green line and rapidly began to move down within the yellow channel.
We can assume that the construction of a new downward wave has just begun. This hypothesis will be confirmed if the market continues to decline and breaks the support level of 1.781, which is on the lower green line. In this case, the price may move towards the lower yellow line and the support level of 1.754.
However, if the bulls can bring the market to the resistance level of 1.802, located on the upper yellow line, and then break through it, then we can expect the price to rise in the direction of the higher resistance level of 1.842, located on the upper line of the green channel.
Both scenarios are shown schematically on the chart.
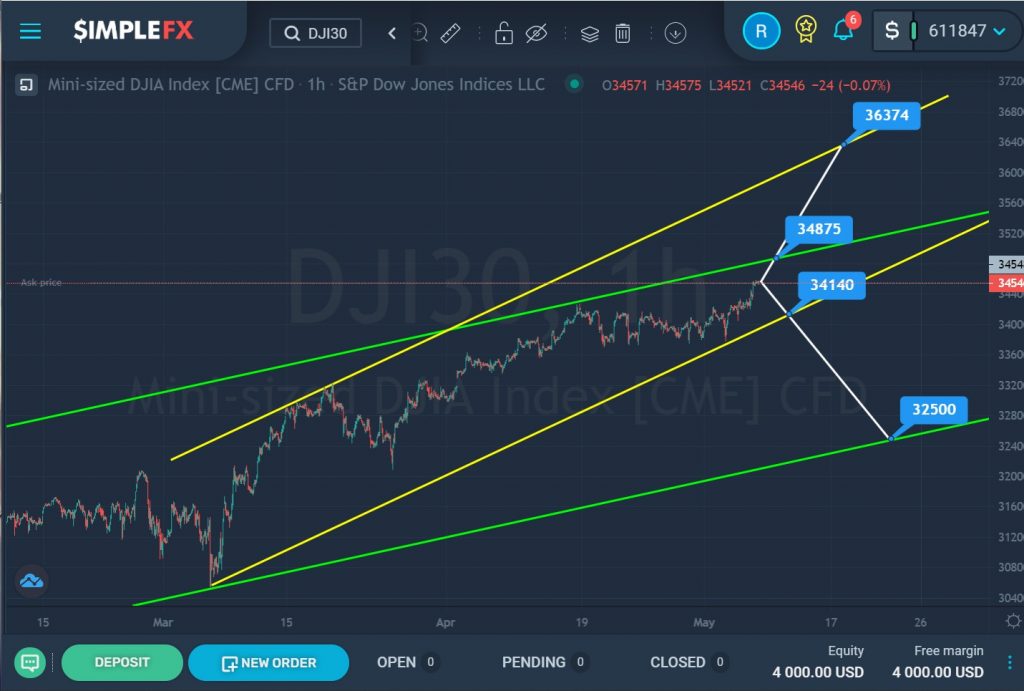
Let’s analyze the situation on the DJI30 index.
On the 1H timeframe, we can see that the market is forming a bullish trend that moves within two channels: yellow and green. The formation of a smaller yellow channel began after the price rebounded from the lower green line.
Currently, the price is near the lower yellow line and the upper green line. In this case, there are two possible scenarios.
If the bulls push a little more, they can reach the resistance level of 34875, then they will open the way to the upper yellow line and the resistance level of 36374.
In the second scenario, it is assumed that the bears will be stronger than the bulls and send prices to the support level of 34140, which is on the lower yellow line. After a successful break of this level, there will be no obstacles for the bears to lead the market even deeper to the lower green line and the support level of 32500.