


A year ago oil prices not only hit the bottom but also broke the rock with negative prices. The event shook the markets. Since then markets went much higher as pandemic concerns were covered with huge piles of freshly printed cash.
SPX500 keeps on pushing towards new records, while USOIL is still waiting to break out. Take a look at our analysis.

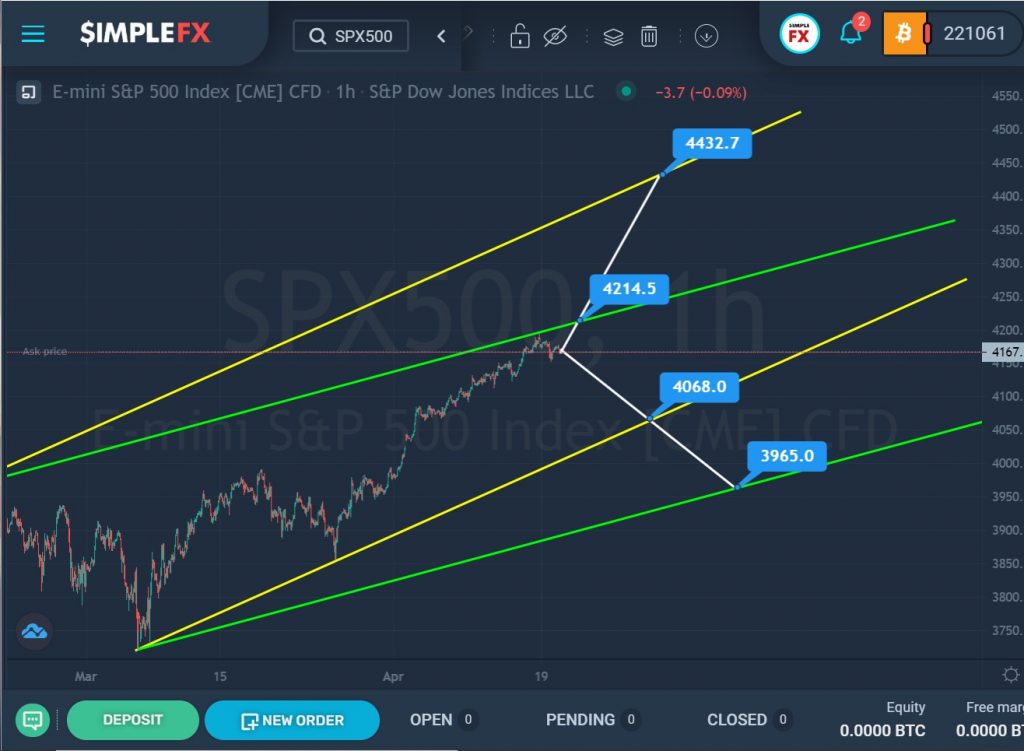
The SPX500 stock index is moving up inside two large channels that are directed at different angles.
In the last section of the chart, we can see that the price has risen from the lower yellow line to the upper green line. If the bulls push a little more, they will be able to break through the resistance level of 4214.5. In this case, the price may further rise to a higher resistance level of 4432.7, which is on the upper yellow wall.
However, the bulls already had an attempt to break through the green line, but they did not succeed, which suggests the weakness of the bulls. In this situation, we can observe a decline in the price. If the market reaches the lower yellow line and the support level of 4068.0 and then breaks it, then the market will have a clear path to the lower green line and the support level of 3965.0.
The approximate scheme of possible future move is shown on the chart.
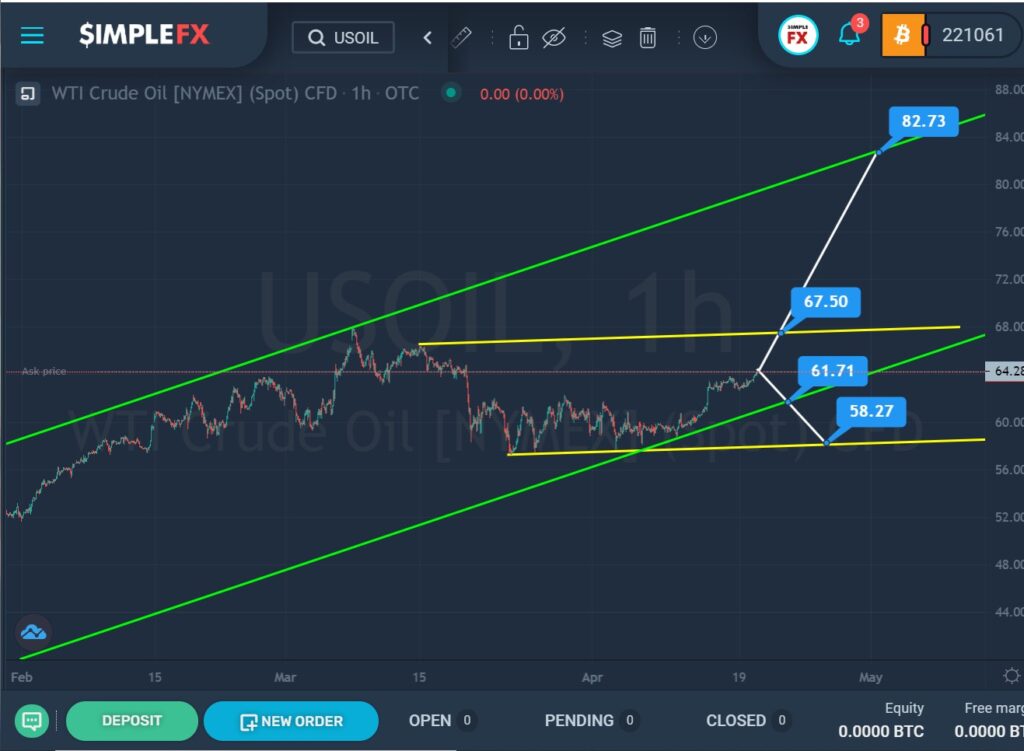
USOIL seems to be forming an uptrend that moves inside the green channel.
After the last rebound from the upper green line, the price went down to the lower green wall, but without breaking through it, it began to move smoothly up. This section describes a small yellow descending channel.
Perhaps the price is moving in the direction of the resistance level of 67.50, located on the upper yellow wall. If this price level breaks, the bulls will have a clear path to the next important resistance level of 82.73, which is on the upper green wall.
It is also worth considering an alternative scenario. According to this view, market participants may see a decline in USOIL. With a successful breakdown of the lower green line near the resistance level of 61.71, the decline may continue even deeper to the lower yellow wall and the support level of 58.27.


