Gold has been climbing for the second day, but the broader outlook may not be so good for XAUUSD. Read our analysis and trade accordingly. Precious metals have been attractive assets for margin traders recently.
In the other analysis, we take a look at the British pound, which stays under pressure from other major currencies. GBPUSD is at the crossroads with one channel seeming to be slightly more likely.
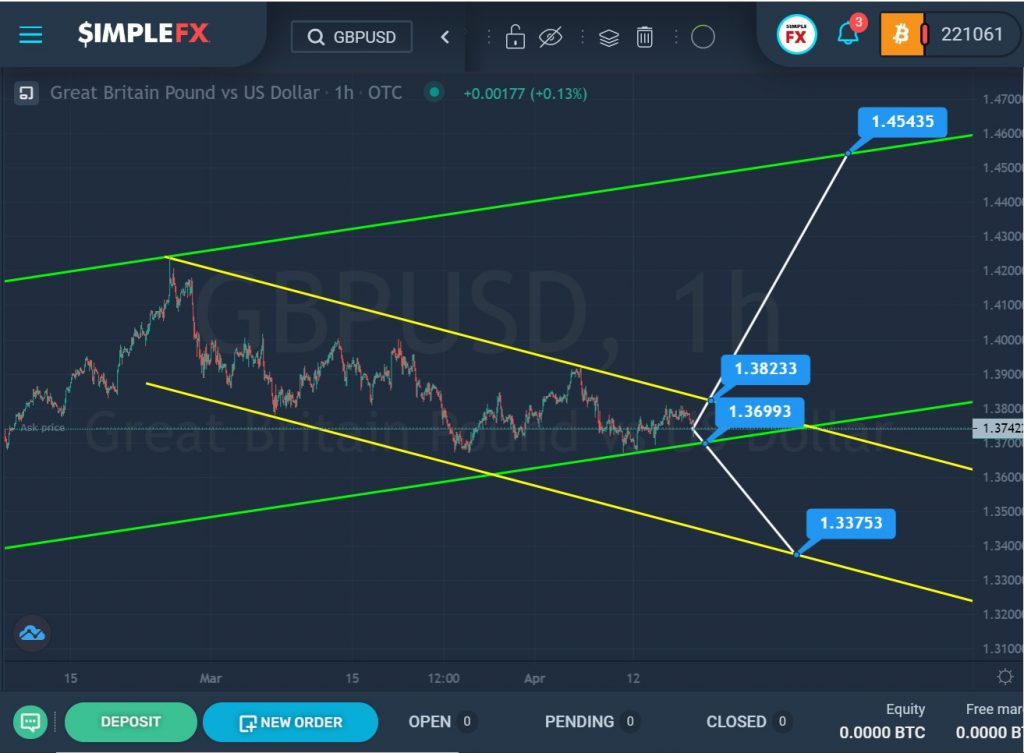
For the GBPUSD currency pair, we see the formation of a bullish trend that is moving in the green channel.
The last section of the chart, where the price pushed off from the upper green line, describes a descending yellow channel.
We see that the bears are confidently leading the market, so there is a high probability that they will break through the support level of 1.369, which is on the green wall. If this level is successfully broken, the bears will open the way to the support level of 1.337, which is on the lower yellow line.
However, the price is currently close to the resistance level of 1.382 and the upper yellow wall. If the bulls take the situation into their own hands and break through the specified level, they will have a chance to rise further towards the next resistance level of 1.454, located on the green line.
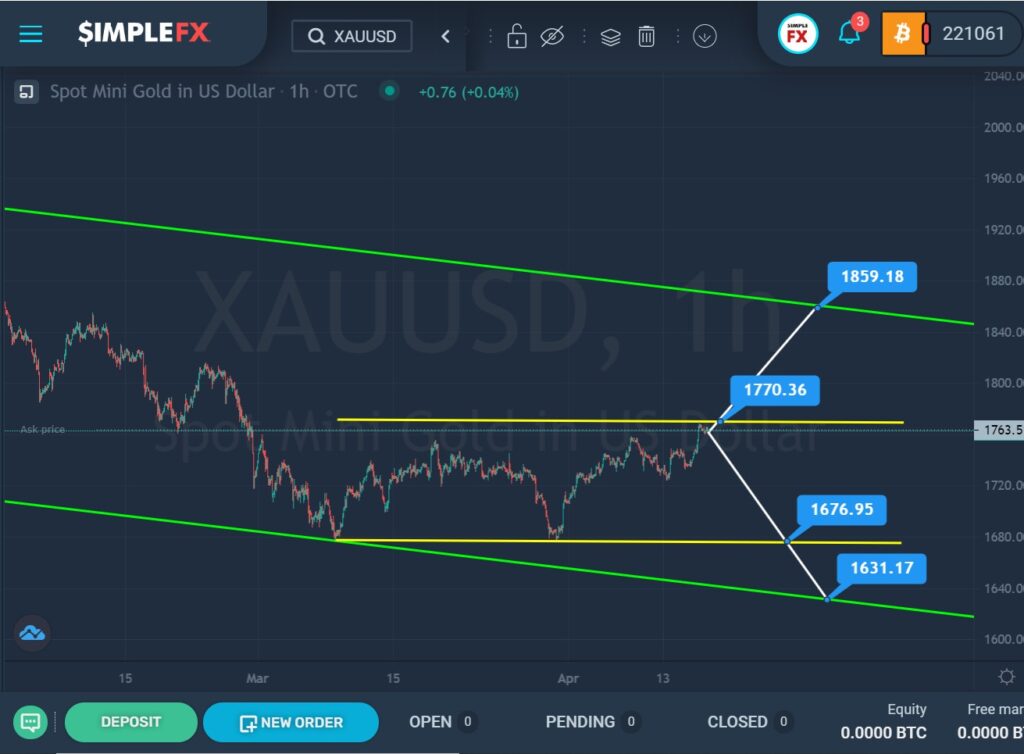
Gold continues to move within the descending green channel and we see the formation of a bearish trend.
In March, the price pushed off from the lower green line and slowly began to rise within the small yellow channel.
At the moment, the market has almost touched the upper yellow wall. If the bulls will break the resistance level of 1770.36, they open the way to the top of the green wall and the resistance of 1859.18.
If the bulls fail to break the yellow wall, then the price will start from it and go down to the support level of 1676.95 located on the lower yellow line.
If the bears are strong enough, then we could see a decline to the lower support level of 1631.17, located on the lower green line, but first, they need to break through the lower line of the yellow channel.