


Today may belong to bitcoin as it hit a new record, but forex may offer even better opportunities for margin traders. Inflation concerns are the biggest volatility drivers for both the Turkish lira and EURUSD. Let’s have a look.

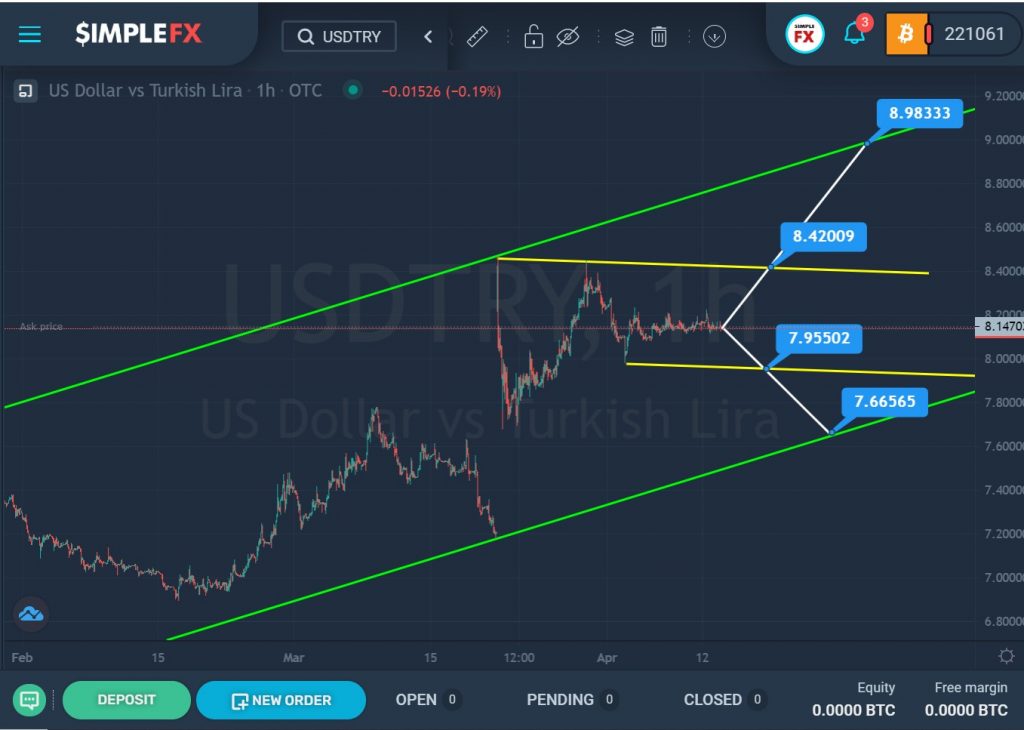
The current structure of the USDTRY currency pair shows the construction of a large bullish trend that moves inside the green channel.
After the last rebound of the price from the upper green line, the pair began to move down within a small yellow channel.
At the moment, we are in the middle of the yellow channel. There are two possible scenarios: the price may start to rise or continue to decline. If the market reaches the upper yellow wall and breaks through the resistance level of 8.420, then we can see the market increase to the next resistance level of 8.983, which is on the upper green line.
If the price continues to fall, we could see the market move towards the lower line of the yellow channel and the support level of 8.420. If the specified level is broken, we will see a decline to the lower support level of 7.665, which is on the lower green line.

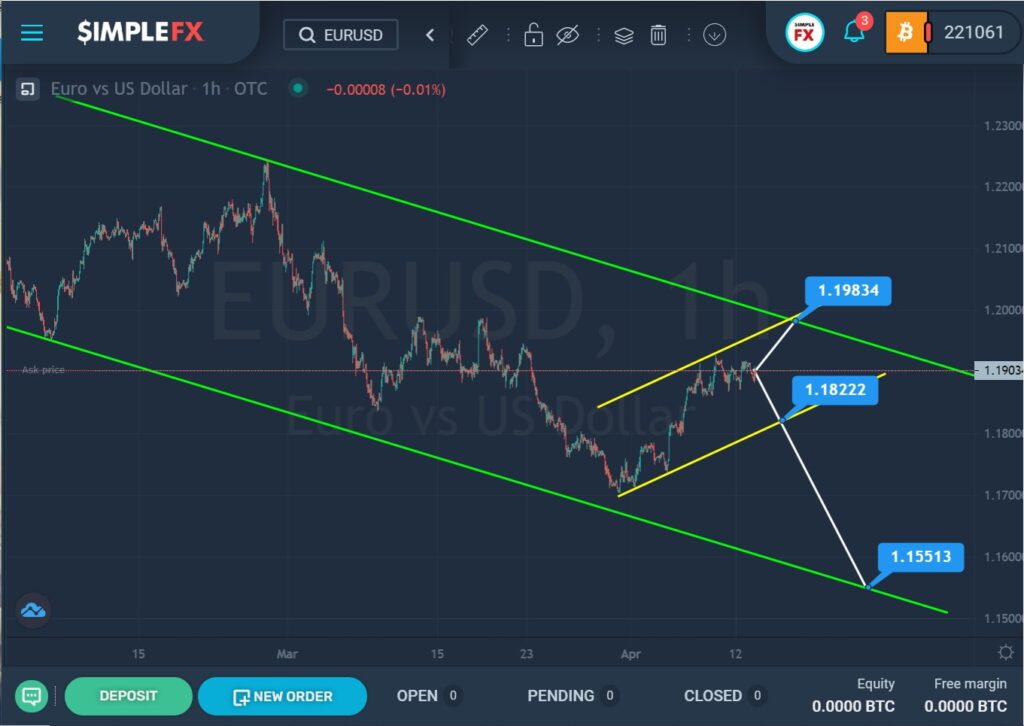
The formation of the EURUSD currency pair hints at a downtrend that moves inside a large green channel.
In the last section of the chart, we can see that the bears did not have enough strength to bring the market to the lower green line. The price turned around and started moving up.
Most likely, in the short term, we will see a continuation of price growth in the direction of the upper green wall and the resistance level of 1.1983.
However, there is a possibility that the bears already have the strength to take over the market. Therefore, a decline in the currency pair is not excluded. If the bears reach the support level of 1.182, which is on the lower yellow line, and break it, then the EURUSD may devalue to the level of 1.155, which is on the support line of the green channel.


