
Everybody is watching Bitcoin closely as it nears the $60,000 level again. Another correction could be deeper than the ones before. Take a look at our detailed technical analysis.
For forex traders, we recommend adding GBPAUD to your watch list.
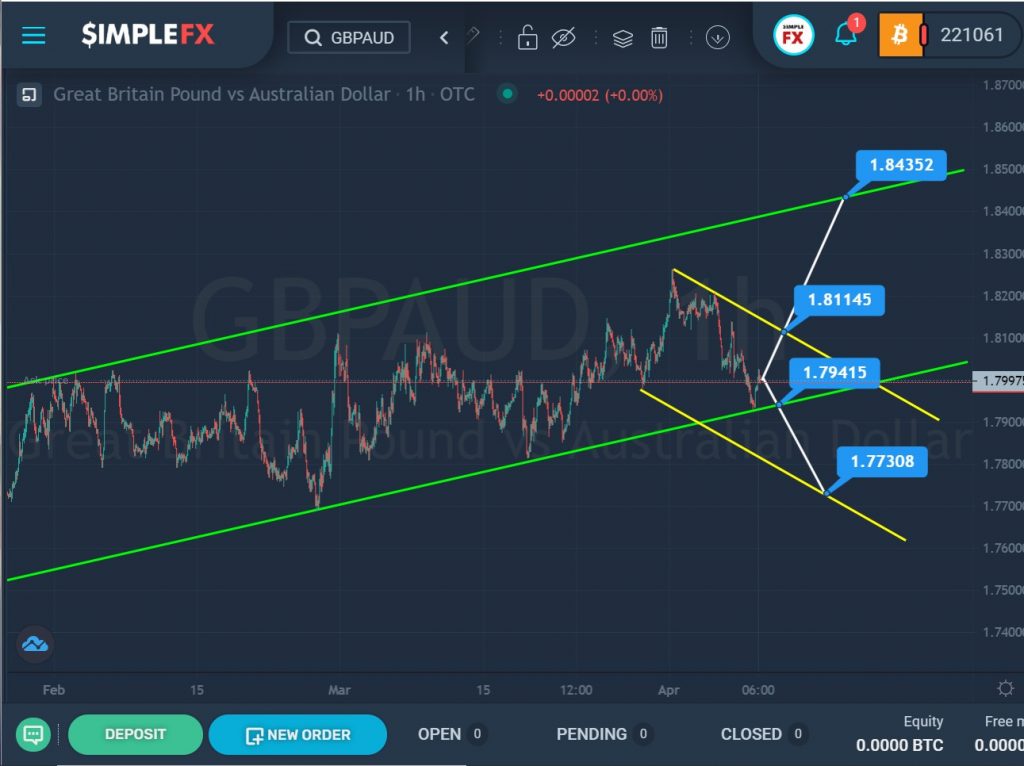
The GBPAUD currency pair moves inside the bullish green channel and forms an uptrend.
In the last section of the chart, the price pushed off from the lower green line and went up. Then, having reached just above the middle of the channel, the price again began to move in a downward direction and again reached the lower green line, but has not yet broken it. This section describes the small yellow channel.
If the market breaks through the support level of 1.794, then we can see the price fall to the lower support level of 1.773, which is on the lower yellow wall.
Alternatively, we are waiting for bullish growth in the direction of the upper yellow wall. With a successful break of the resistance level of 1.811, which is on it, the price can rise even higher to the upper green line and the resistance level of 1.843.
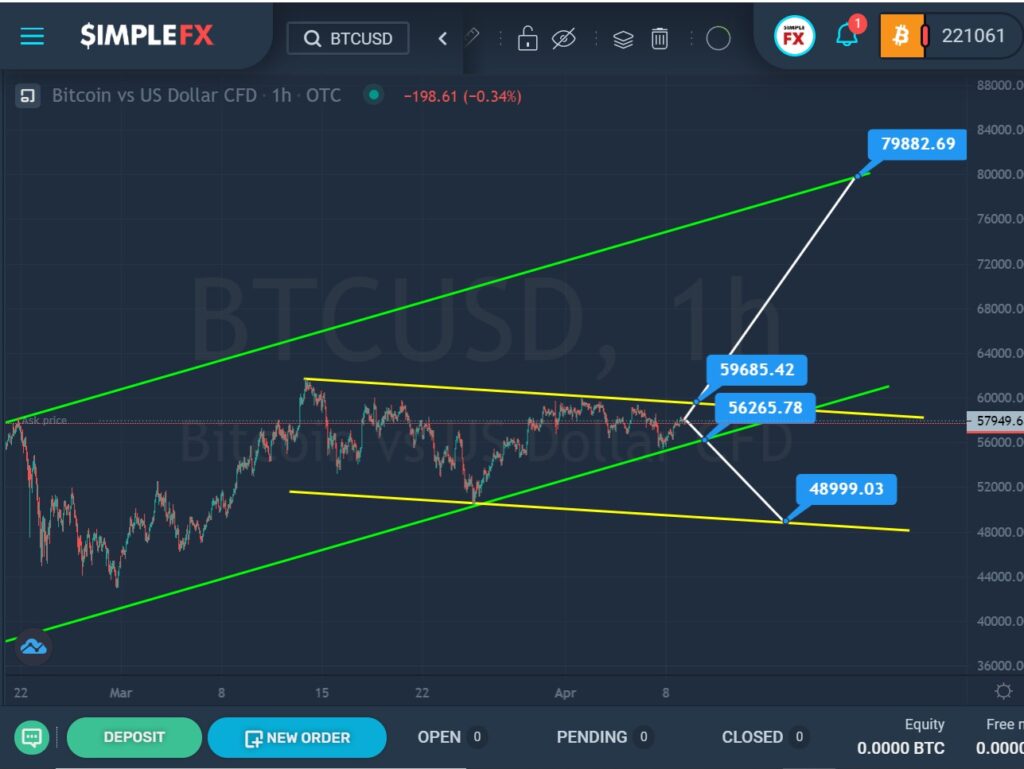
For the BTCUSD cryptocurrency pair, we see the development of an uptrend inside a large green channel.
In the last section of the chart, we see a decline in the price to the lower green line, which began in the middle of last month. It seems that the market has started to build a downtrend that moves inside the smaller yellow channel.
Our assumption will be confirmed if the market breaks the support level of 56265.78, which is on the lower green line. Then the path will open for a further decline to the lower yellow line and the support level of 48999.03.
However, an alternative situation is possible in which the pair will break through the resistance level of 59685.42, as it is very close to this price mark. If this level is broken, market participants can expect a continuation of the price increase in the direction of the upper green line and the resistance level of 79882.69.