

US equities push for new all-time highs again. Take a look at our DJI30 analysis. For forex traders, we break down EURJPY, where bullish channels suggest the euro should go up against the yen.

The formation of the EURJPY currency pair shows an uptrend that moves inside a large green channel.
Over the past month, the price has declined from the upper line to the lower line of the green channel. After that, the market pushed off from the lower green wall and went up within a small yellow channel.
We can see that the price does not go beyond the lower yellow area. The price is so close to the yellow wall, that perhaps soon the market will break through the support level of 130.21, which is on it, and repeat the decline to the lower green line and support level of 129.21.
Alternatively, we can expect a continued increase of the currency pair, within the yellow channel towards the top of the green line and the resistance level of 132.13.
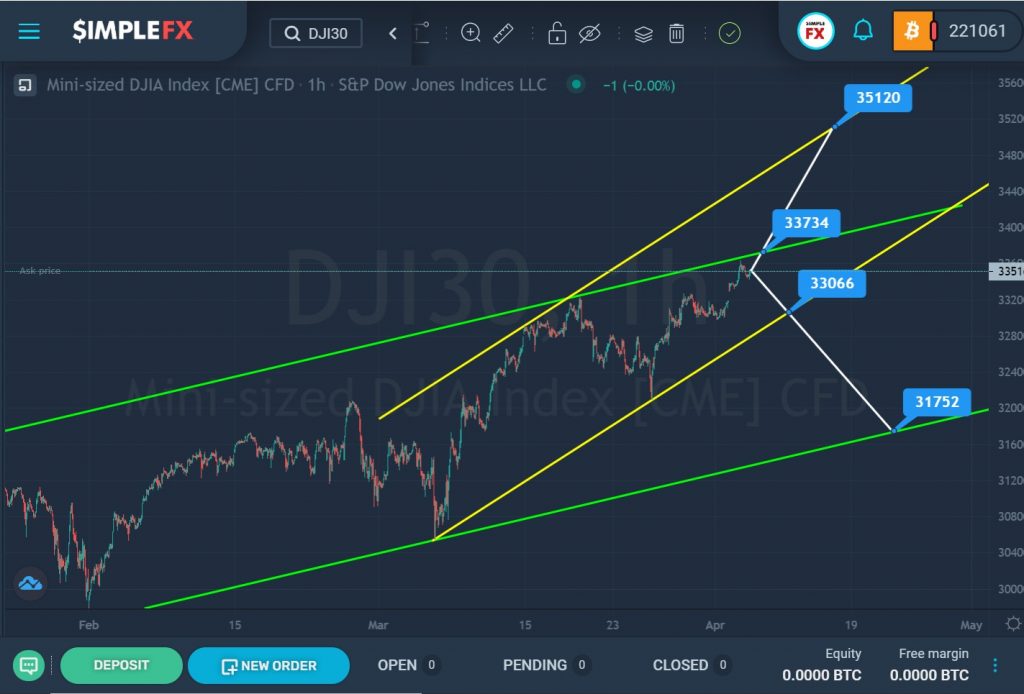
The current structure of the DJI30 stock index shows the formation of an uptrend that moves inside the big green channel.
In the last section of the chart, we can see that the market has pushed off from the lower green line and has been moving up along the yellow channel over the past month. Not so long ago, the price again touched the upper green wall but did not break it.
It is assumed that the market will repeat the previous scenario, and go down to the lower green line. But first, the bears need to break through the support level of 33066, located on the lower yellow wall. If this level is broken, the bears will have a clear path to the next support level of 31752, as shown in the chart.
However, we should not exclude the possibility that the bulls will not give up their positions so soon. Perhaps they will still be able to break through the resistance level of 33734, which is on the upper green line. Then we expect an increase in stock prices to a higher level of 35120, located on the upper line of the yellow channel.