

Yesterday Dow Jones closed at a historic record, however, tech companies didn’t perform as well. Nasdaq is at a crossroads at the moment. Take a look at our analysis.
As for Forex, USDCAD should be the pair to trade this week.
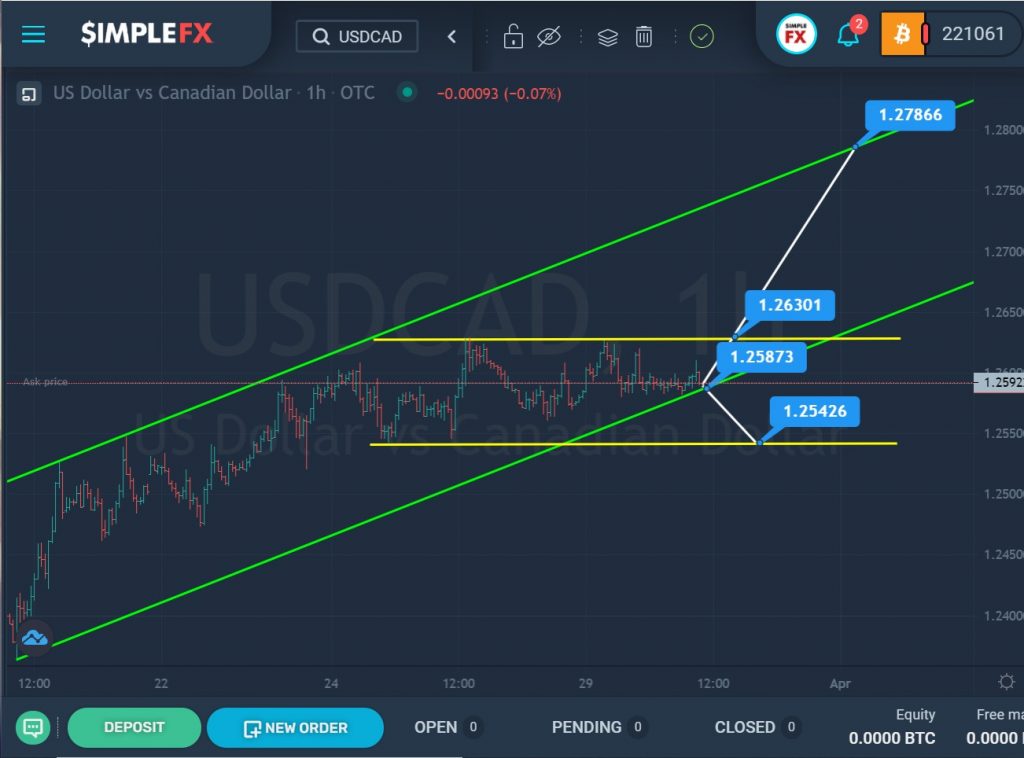
The USDCAD currency pair shows the construction of an uptrend moving inside the green channel.
Since March 24, the market has started moving in a horizontal direction within a small yellow channel.
To date, the price has reached the lower green zone. If the bears can break through the support level of 1.258, then the decline can be continued to the lower yellow wall and the support level of 1.254.
However, if the bears do not have enough strength to break through the lower green line, then the market will push off from it and go up. If the upper line of the yellow channel is successfully broken in the area of the resistance level of 1.263, the bulls will open the way to the next resistance level of 1.278, which is on the upper line of the yellow channel.
Let’s see what scenario the USDCAD pair will continue its development.
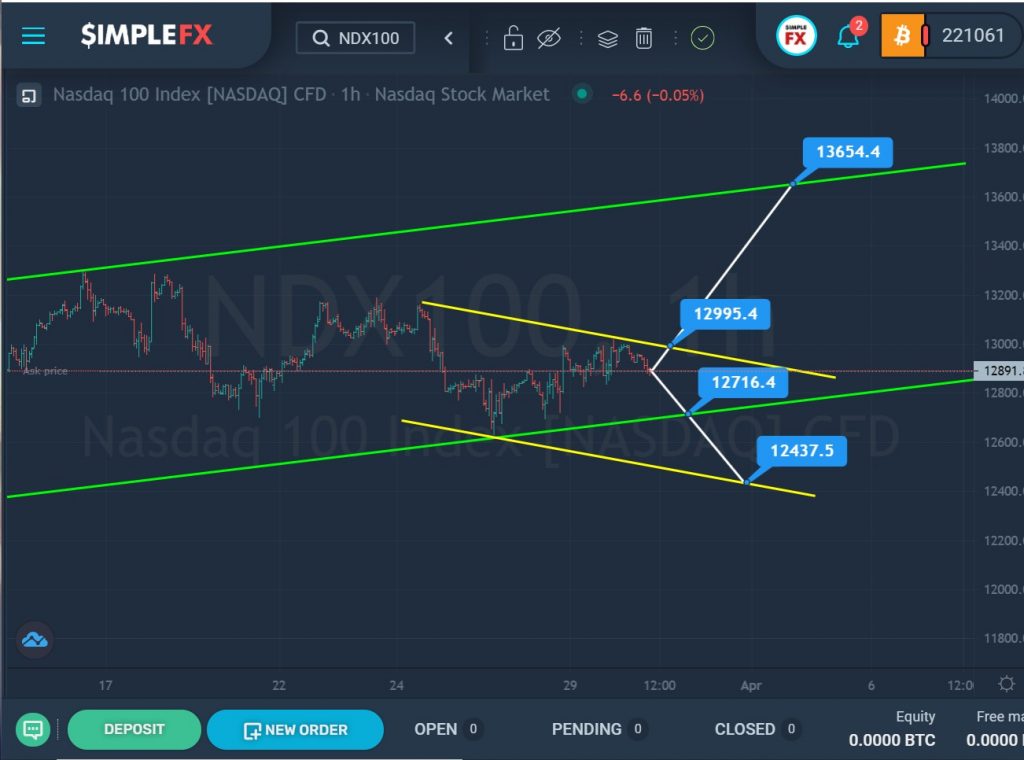
The NDX100 stock index shows the construction of a large uptrend that moves inside the green channel.
Just a couple of weeks ago, the market pushed off from the upper green line and began to decline slowly. However, after reaching the lower green line, the market turned around and continued to move in the opposite direction.
The last section of the chart describes a small yellow channel.
It is likely that we may see a repeated decline towards the lower line of the green channel. If this time the bears can break through the support level of 12716.4, then the decline will continue to the lower support level of 12437.5, located on the lower yellow line.
Alternatively, we can assume that the bulls will first bring the price to the upper yellow wall, and after breaking through the resistance level of 12995.4, they will lead the price to the higher resistance level of 13654.4, which is on the upper green line.