


We have entered an interesting moment for the USOIL. Take a look at our analysis and make your call.
In the second part, we discuss the USDJPY chart, which is also showing great trading opportunities. Enjoy
Global crude oil prices have dropped by 1% on concerns over slow fuel demand recovery as the third wave of Covid-19 infections hits Europe and producers cut oil prices.

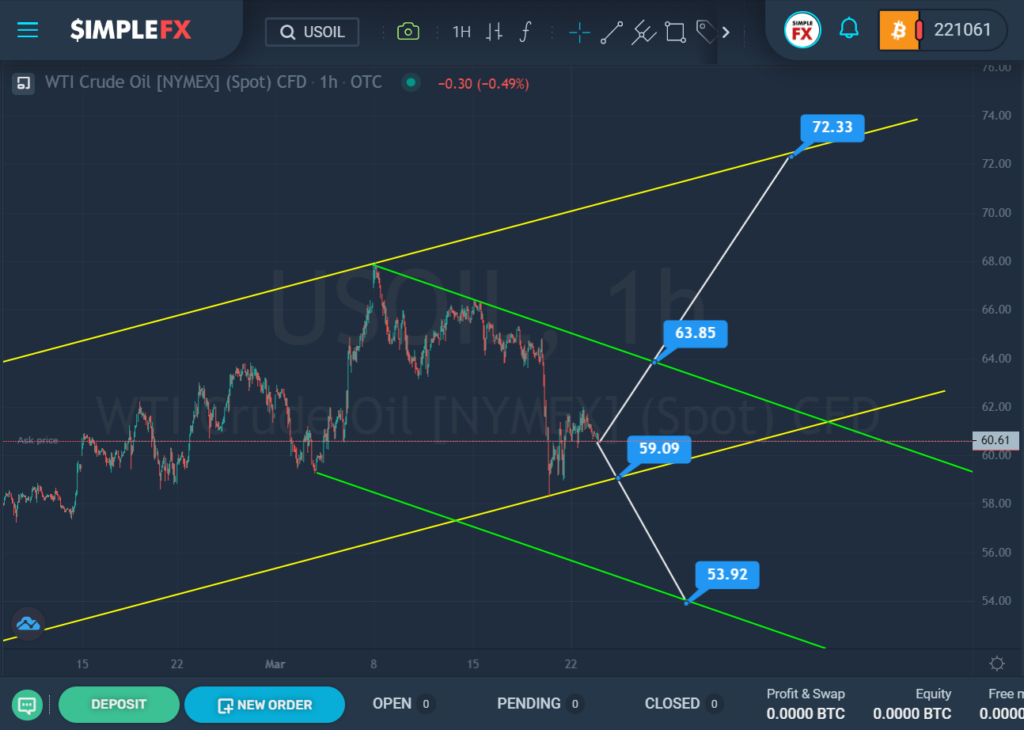
The oil market has been moving in a large ascending yellow channel for a long time. This indicates a strong and stable bullish trend. After reaching and rebounding the price from the upper line of the yellow channel, we saw a corrective decline of the market to its lower wall.
The bears managed to touch the lower yellow line, after which they went up a little. At the moment, the market is at a crossroads, either to continue moving up to the upper line of the green descending channel and the resistance level of 63.85 or to decline to the yellow wall and the level of 59.09.
If we see a rise to 63.85 and a break of this price level, the way will open for the bulls in the direction of the upper line of the yellow channel and the resistance level of 72.33. If the price moves along this option, we will see a strong bullish trend.
If the bears reduce the price to 59.09 and this level is broken, they will open the way to the lower green line and the level of 53.92.
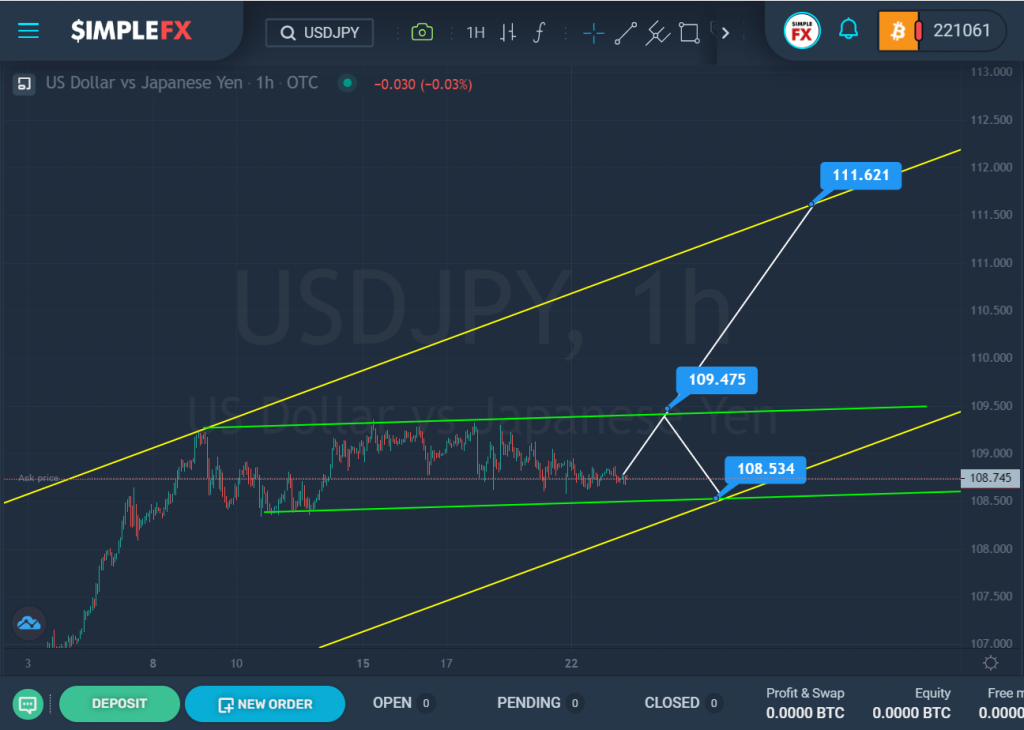
For USDJPY, during the previous trading weeks, we see a strong uptrend, which, like oil, moves in a bullish yellow channel. A characteristic feature of this chart is the fact that during the last trading days the market moves in a narrow flat, which is limited by the lines of the green channel.
If the price rises to the upper line of the green channel and the resistance level of 109.47, the growth of the currency pair will continue to the upper yellow wall and the resistance of 11.62. Thus, in the event of a break of 109.47, market participants will expect a powerful bullish trend that can be used to make a profit.
However, if the bulls fail to break through 109.47, the market may decline to the lower lines of the yellow and green channels, that is, to the support level of 108.53.
The approximate scheme of possible future movement is shown on the chart.


