Both XAUUSD and SPX500 are seemingly at a crossroads. Gold may go both ways in the next hours. SPX500 shows some stronger upward inclination, but the market should be very volatile on Friday. Take a look at our chart analysis below.
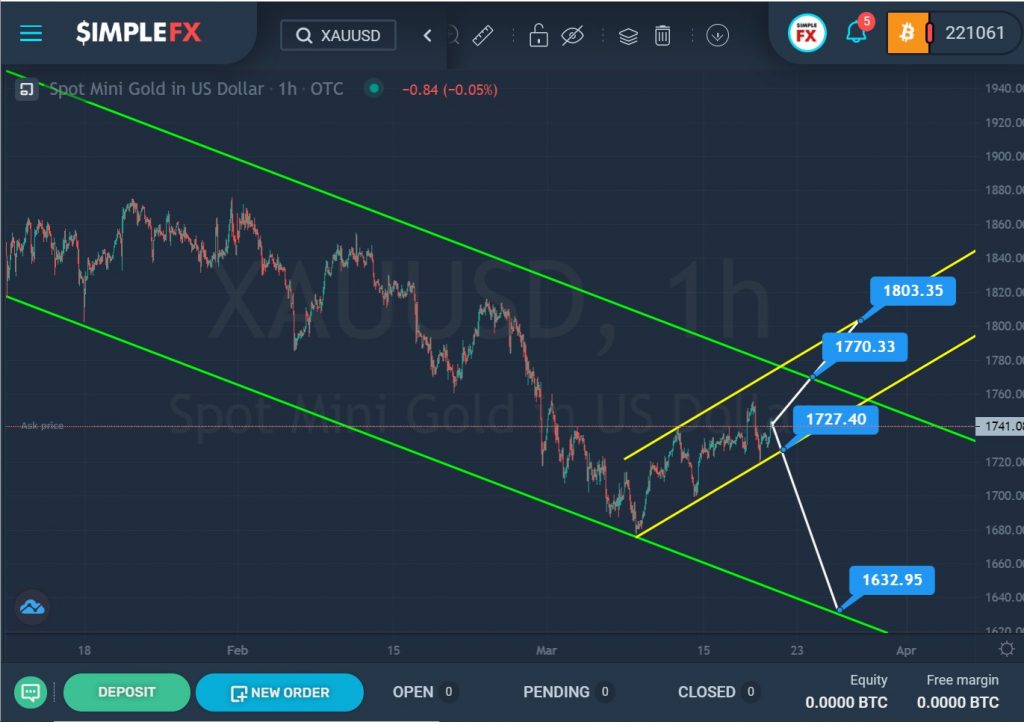
The current gold structure shows a downtrend moving inside a large green channel.
Over the past month, we have seen a gradual decline in the price towards the lower green zone. Not so long ago, the market touched the lower green wall, but did not break through it, but turned around and began to move in the opposite direction within a small yellow channel.
At the time of writing, the price is located approximately in the center of the yellow channel. There are two options in the current situation: a continuation of the bullish move, or a reversal of the price and its decline.
If the price reaches the resistance level of 1770.33, which is on the upper green line, and then breaks it, then it will be free to go to the upper line of the yellow channel and the resistance level of 1803.35. However, if XAUUSD starts moving down and can break through the yellow support line near the level of 1727.40, then we will see a continuation of the downtrend to the lower green wall and the support level of 1632.95.
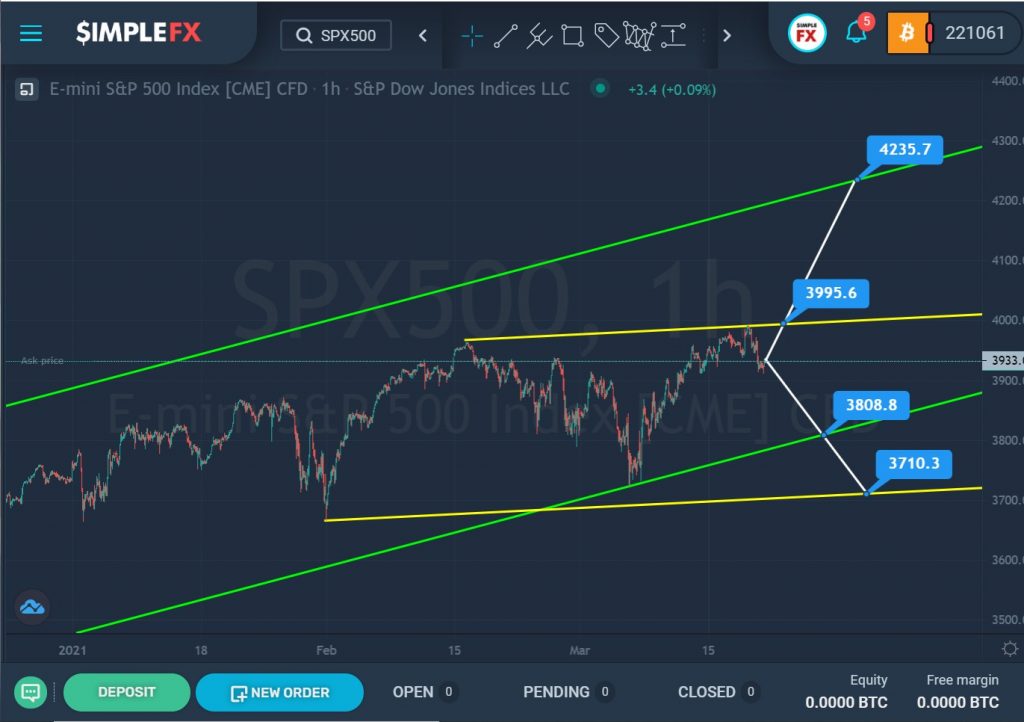
The SPX500 stock index forms an uptrend that moves inside the green channel.
It is assumed that since February, the market has started to build a horizontal trend with an upward slope, which moves within the yellow channel.
Recently, the price touched the lower green wall, then we saw a market reversal and its rise. Then the market touched the upper yellow wall, but could not break through it. Perhaps the bulls will try to break through the yellow line again. If the level of 3995.6 breaks, they will succeed and the bullish movement will continue to the higher resistance level of 4235.7, which is on the upper green wall.
However, there is a possibility that the bears are stronger than the bulls, so market participants may see the market move down. If the support level of 3808.8 is broken, which is on the lower green line, the price may fall even lower to the level of 3710.3, which is on the yellow support line.