


EURUSD is at the crossroads, while GBPUSD can move even stronger. Looks like the US dollar is gaining some traction. Take a look at our forex analysis for this week.

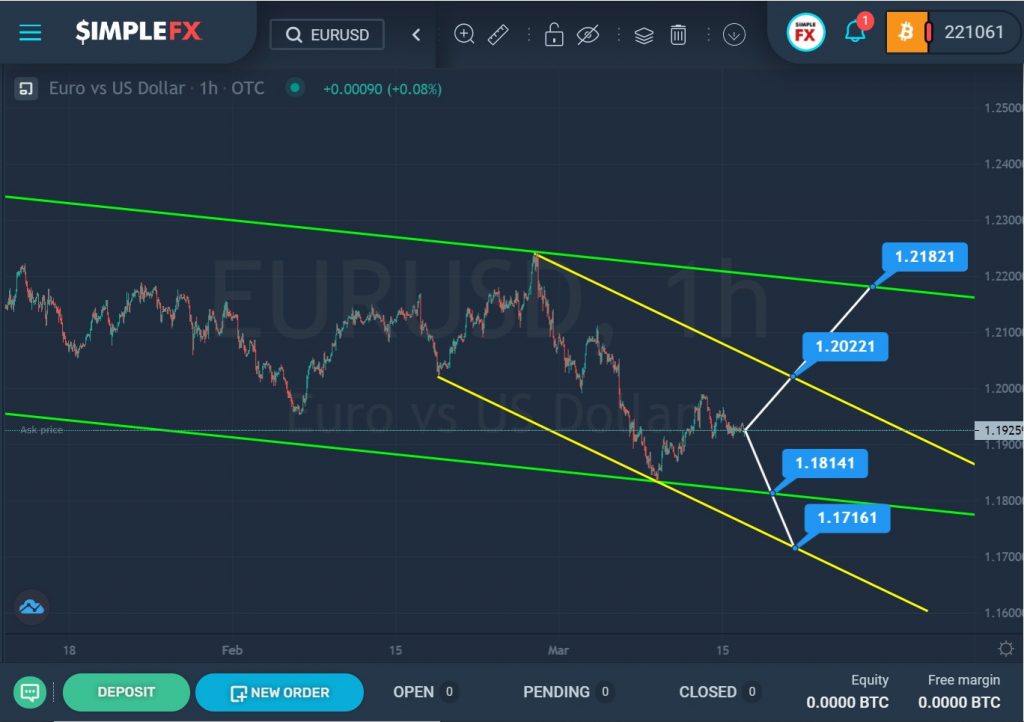
The current structure of the EURUSD currency pair shows a downtrend that moves inside the large green channel.
At the end of February 2021, the price touched the upper green line, then pushed off from it and began to move down along a small yellow channel. Not so long ago, the currency pair reached the intersection of the two lower lines of the green and yellow channels, after which we saw a market reversal and its rise.
Most likely, in the next coming trading weeks, we will see an upward movement of the price. With a successful break of the upper yellow line and the resistance level of 1.202, the bulls will open the way to the upper green wall and the next important level of 1.218.
However, the possibility of continuing the formation of a downtrend is not excluded. With a successful break of the lower green line and the support level of 1.181, the decline may continue even lower- to the lower yellow wall and the support level of 1.171.

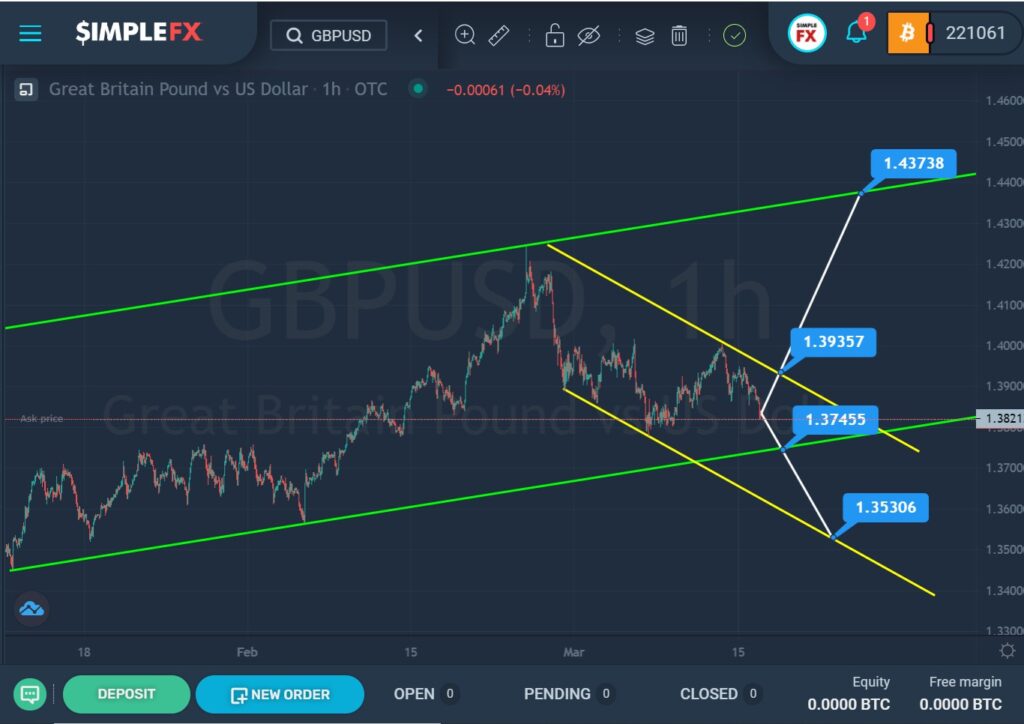
A few weeks ago, we considered the GBPUSD currency pair. Currently, we see that the market continues to build a global bullish trend, which moves within the ascending green channel.
By the end of February 2021, the market managed to reach the upper green line, then it pushed off from it and began to fall rapidly. The last section of the chart describes a small yellow channel.
Now we are in the upper zone of the yellow channel and near the lower green line. In the current situation, both the growth and the fall of the currency pair are possible. If in the near future, the price touches the upper yellow wall and breaks through the resistance level 1.393, then market participants will expect the development of the upward trend in the direction of the top of the green wall and the resistance level of 1.437.
But if the price will reach the lower line of the green channel and breaks through the support level 1.374, in the short term, we will see a devaluation to the bottom line of the yellow channel and the support level of 1.353.


