

Bitcoin is about to set a new all-time record… or bounce off the resistance once again. Take a look, what our chart analysis says.
Meanwhile, the Turkish lira stays the most exciting forex currency. Make sure you watch USDTRY and other TRY cross pairs closely!
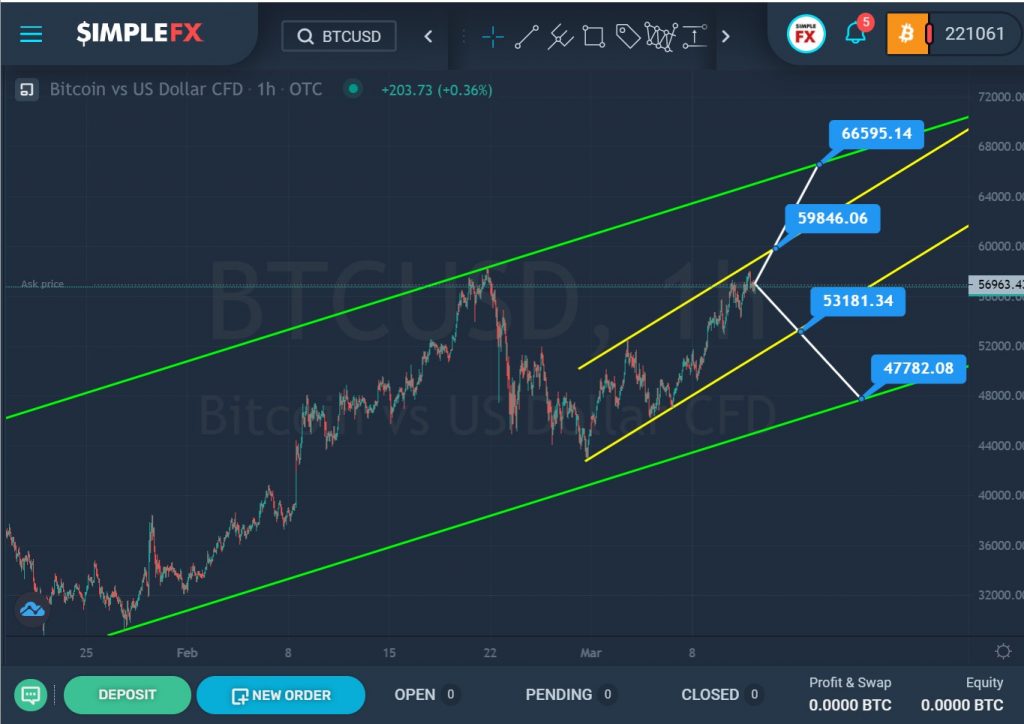
The BTCUSD cryptocurrency pair continues to develop an uptrend, as in previous trading weeks, which moves within a large green channel.
Not so long ago, we saw the price rebound from the upper green line, then its sharp fall. However, the price did not reach the lower line, but turned around and began to move up – along a small yellow channel.
If the price growth continues further, and the bulls manage to break through the resistance level of 59846.06, which is on the upper yellow wall, then we can see the continuation of the increase of the cryptocurrency pair to the next resistance level of 66595.14, located on the upper green line.
In the alternative, market participants will see a decline in the market. Upon reaching the support level of 53181.34, which is on the lower line of the yellow channel, and then its break, the decline may continue to a lower support level of 47782.08, which is on the lower green wall.
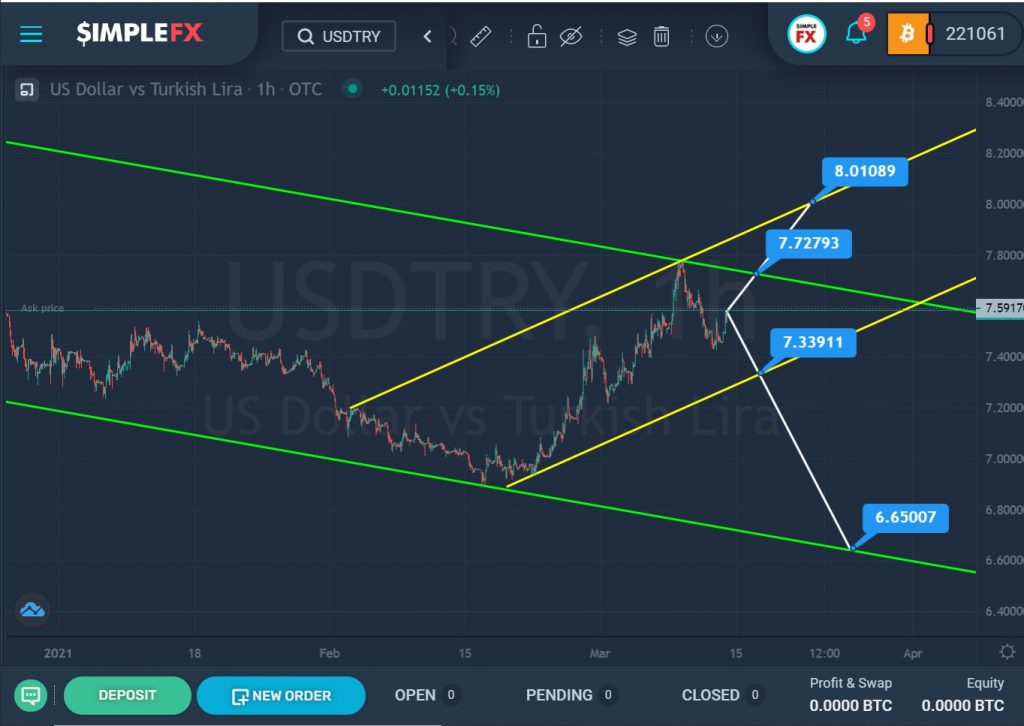
The formation of the USDTRY currency pair hints at a global bearish trend that is moving inside the green channel.
For some time, the price was in the lower zone of the green channel, and in the second half of February 2021, it touched the lower line, after which it pushed off from it and began to rise sharply within the yellow channel. Then the price touched the upper green line but did not break it.
It is possible that the bulls are still full of strength, so an attempt to break through the upper green wall may be repeated. If the resistance level of 7.72 breaks, they will succeed and the path to the upper yellow line and the resistance level of 8.01 will be clear.
Alternatively, the situation where the bulls are inferior to the bears is considered. In this case, we expect a reduction in the price. In the event of a break of the first support level of 7.33, which is on the lower line of the yellow channel, the decline will continue to the lower level of 6.65, which is on the lower green wall.